Figures of Merit
In previous articles, we have described methods to reduce the complexity of image sensor specifications into figures-of-merit such as SNR and Relative SNR. These figures-of-merit allow us to make efficient comparisons between different imaging technologies under a range of conditions, from very low light to bright light.
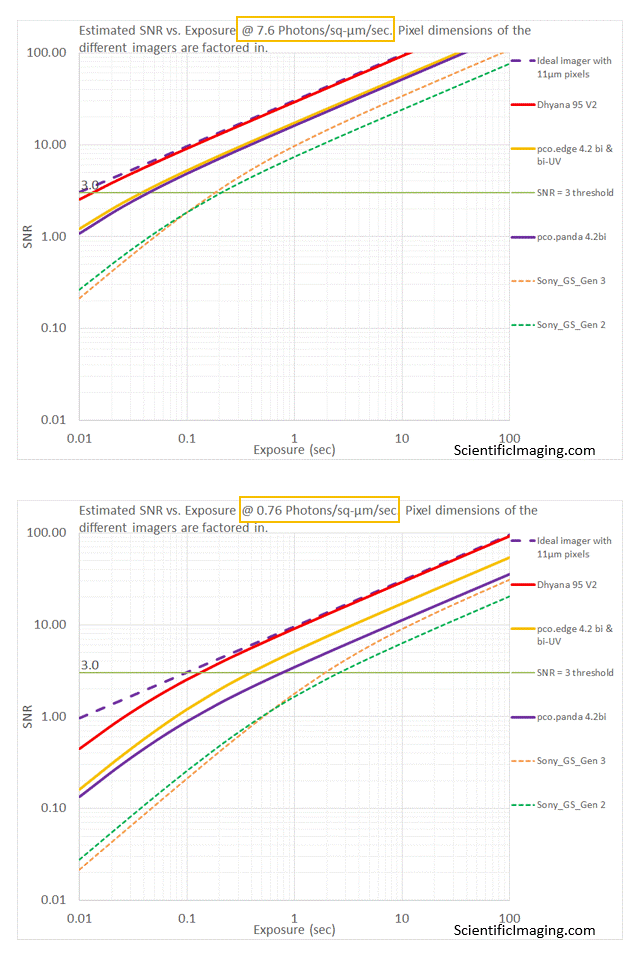
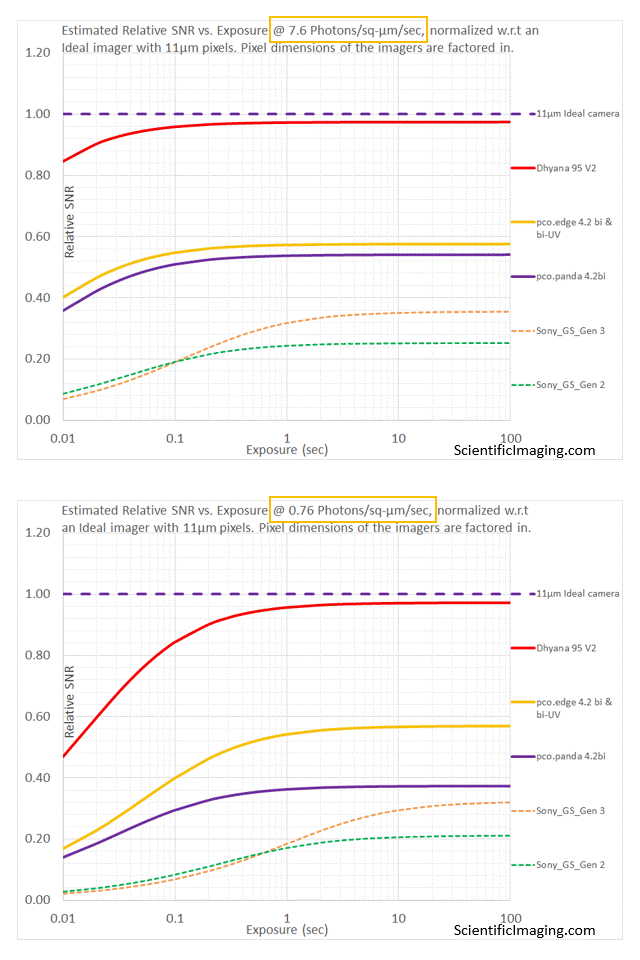
The above method provides valuable insight and prevents users from making costly errors. However, it is not without its challenges. For example, one has to go through the exercise of plotting graphs for a variety of cameras, sometimes at different wavelengths (accounting for the fact that QE varies with wavelength).
In this article we look for additional figures-of-merit that simplify the process of camera selection, building on the knowledge gained in the previous material. The goal is to reduce the problem of camera selection to a matter of (a) identifying which figures-of-merit are most applicable and (b) finding a camera that scores the highest on that figure-of-merit, within one’s budget. Most camera manufacturers provide QE curves and specifications such as pixel size, Read Noise and Dark Current. Some manufacturers even provide Photon Transfer Curves – in some cases these are part of a protocol, such as the EMVA1288 standard. Users can benefit from the wealth of information available from camera manufacturers if they could distil the information into a few figures-of-merit that correlate with how a camera with given specifications will interact with the imaging conditions of their specific experiment.
For example, in a light starved imaging application, it is always advisable to seek a camera with a high QE, but how does one compare two cameras from completely different price ranges that have different combinations of QE, Read Noise and pixel size? Since these parameters impact Signal and Noise under different imaging conditions, our goal is to condense these readily available specifications into figures-of-merit that can help us make informed camera selection decisions under different types of imaging conditions.
We begin with a simple estimation that typically applies only to bright light conditions: it is based on the Full Well Capacity (FWC) of an imager. FWC is the maximum number of electrons that can be captured in a pixel before the “bucket” overflows (here we hearken back to the faucet and bucket analogy from previous articles). Mathematically, this can be represented as P*a*QE*t = FWC, which can be re-arranged as: P*t = FWC/(a*QE). This gives us our first figure-of-merit, defined as the coefficient: Cf = FWC/(a*QE), a measure of the maximum number of Photons that can be incident per sq-μm of the imager before it saturates. If we know the value of “P”, the Photon Flux Density in Photons/sq-μm/sec, we can estimate that the imager will saturate if the exposure “t” exceeds Cf/P seconds. Cf is inversely proportional to the QE, which is specified via the QE curve of a camera as a function of wavelength. Therefore, Cf is also a function of wavelength. Note that this figure-of-merit applies to bright light conditions and does not directly impact SNR calculations, except to estimate an upper range of exposure “t”. For this reason it is largely omitted from the discussion below.
For figures-of-merit that relate to SNR, we consider this equation from the previous article, which factors in pixel size into the SNR equation:
SNR = P*a*QE*t/Sqrt(P*a*QE*t + Nr2 + Id*t) ——————– [Equation #6]
The simplified SNR calculations for the Read Noise limited and Photon Shot Noise limited regions are shown below in which some of the above noise-terms are negligibly small in comparison with others. In the first part of the discussion, it is assumed that Id*t is negligibly small (we will account for it later). The above equation is reduced by omitting the Id*t term:
SNR = P*a*QE*t/Sqrt(P*a*QE*t + Nr2 + Id*t) ——————– [Equation #7]
At very low light levels and/or at very short exposures, P*t is very small. The Photon Shot Noise term in the denominator of Equation #7 (P*a*QE*t) is likely to be negligibly low in comparison with Nr2, the Read Noise term. Such a system is said to be Read Noise limited. Under these conditions, Equation #7 can be simplified to:
SNR = P*a*QE*t/Sqrt(P*a*QE*t + Nr2 ) ≈ P*a*QE*t/Nr
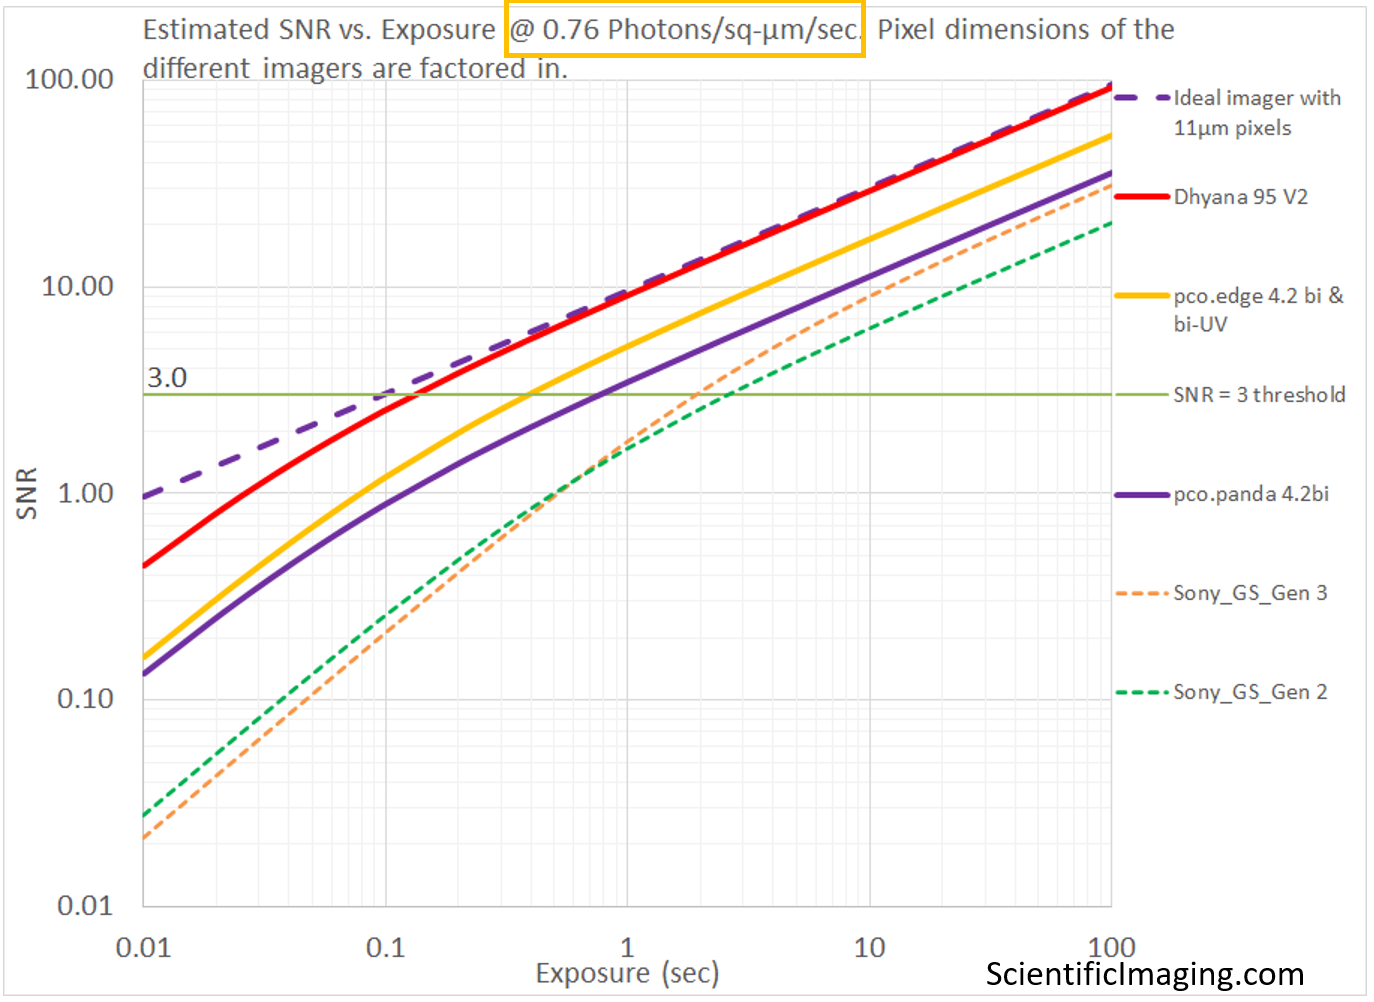
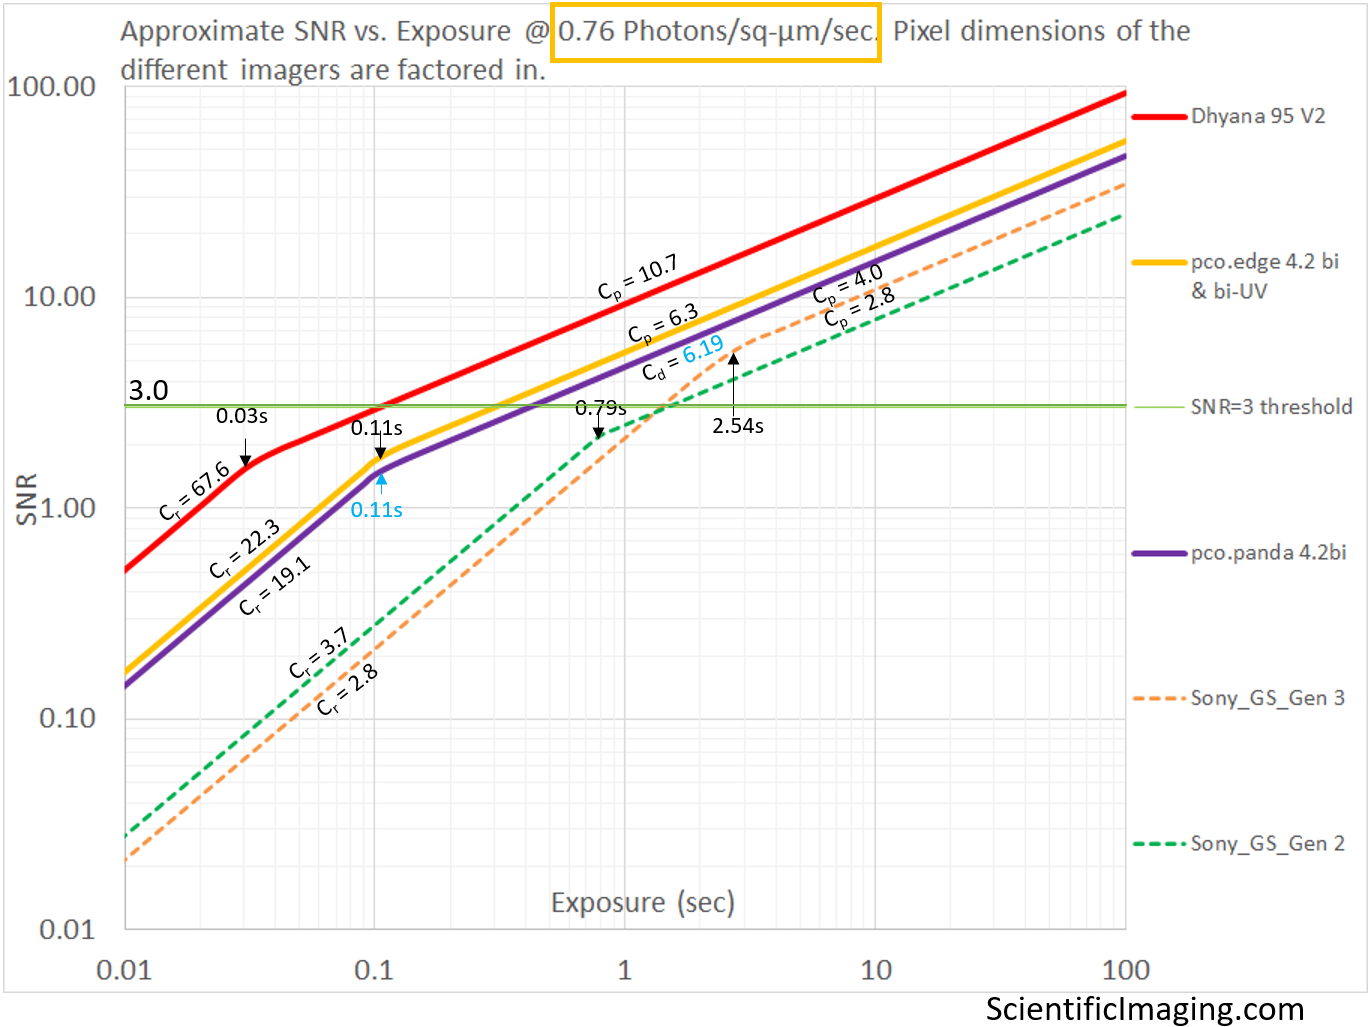
From this, we can infer a figure-of-merit Cr for an imager under very low light conditions as: a*QE/Nr, the SNR that it would achieve if P*t = 1, i.e. if an exposure resulted in 1 incident photon/sq-μm in a Read Noise limited system. This figure-of-merit is a function of wavelength, and may be thought of as a coefficient of the SNR under low light conditions (see graphs below). This coefficient is a number, which when multiplied by the number of photons/sq-μm gives us an estimate for the SNR under low-light conditions. An imager for which this coefficient is higher than for others is better suited for fast, low-light imaging applications. Under these Read Noise limited conditions, SNR ≈ Cr*P*t, a linear function of exposure.
At higher light levels, Photon Shot Noise is likely to be much higher than Read Noise. Such a system is said to be Photon Shot Noise limited. In the Photon Shot Noise limited case, Equation #7 can be simplified to:
SNR = P*a*QE*t/Sqrt(P*a*QE*t + Nr2) ≈ Sqrt(P*a*QE*t)
From this, we can infer a figure-of-merit Cp for an imager under relatively bright conditions as: Sqrt(a*QE). This coefficient is a number, which when multiplied by Sqrt(P*t), i.e. the Sqrt of the number of incident photons/sq-μm in each exposure, gives us an estimate for the SNR under bright light conditions. This figure-of-merit is a function of wavelength due to the dependence of QE on wavelength. An imager for which this coefficient is higher than for others is better suited for bright-light imaging applications. Under these Photon Shot Noise limited conditions, SNR ≈ Cp*Sqrt(P*t), representing a square root relationship with exposure.
The crossover between Read Noise limited and Photon Shot Noise limited regions, a concept that was introduced in the article titled Noise-limited performance of cameras, can be estimated to occur at: t = Nr2/(P*a*QE) seconds. This suggests a third figure-of-merit Ce as a measure of the crossover, as: Nr2/(a*QE). An imager for which this number is lower than for others is better suited for fast, low light imaging. This figure-of-merit is also dependent on wavelength, since it is inversely proportional to the QE.
Ce is the exposure at which the Read Noise limited SNR and the Photon Shot Noise limited SNR are equal for a Photon Flux Density of 1 photons/sq-μm/sec. From this, we can infer that coefficients Cp, Ce and Cr are related. Indeed a little algebraic substitution shows the following: Ce = (Cp/Cr)2
What about Dark Shot Noise?
In the previous examples, we assumed that Dark Shot Noise is negligibly small. This is often true, because:
- Under relatively bright light conditions the Photon Flux is large enough to produce Photon Shot Noise that is much higher than the Dark Shot Noise
- The camera is cooled, and therefore the Dark Current of the imager is so low that the Dark Shot Noise is negligibly smaller than Photon Shot Noise – even under low light conditions.
This suggests an additional figure-of-merit that can be used to characterize a camera. When the Photon Flux is high, Dark Shot Noise is negligibly low – but at what level of Photon Flux is this no longer true? At what point does the Dark Shot Noise start to impact Total Noise? If we can predict this, then it can help us in eliminating cameras that would be Dark Shot Noise limited under the conditions of a specific application.
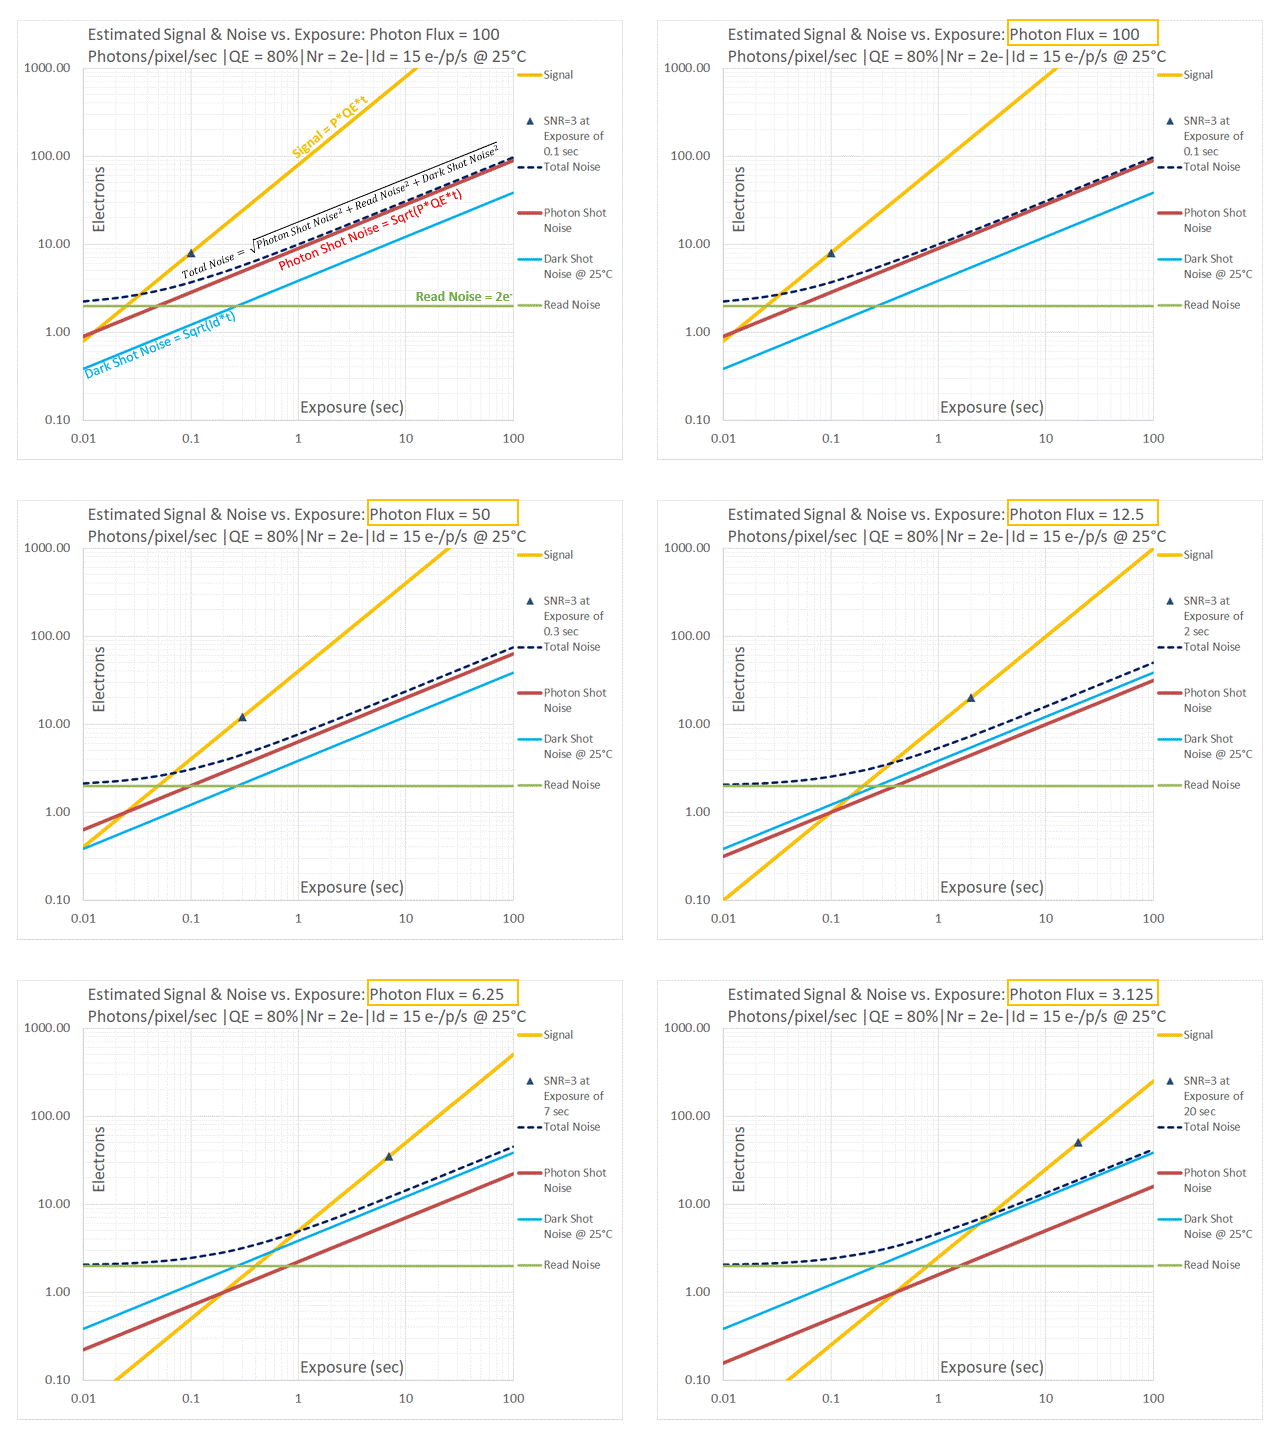
In addition to the relative position of the red [Photon Shot Noise] and blue [Dark Shot Noise] lines in the above sequence, one can also observe their contributions to Total Noise. As the Photon Flux drops to 50 and then 25 photons/pixel/sec the dashed black line (representing Total Noise) start to lift off from the red line representing Photon Shot Noise due to the effect of Dark Shot Noise (shown in blue). At a Photon Flux of 12.5 photons/pixel/sec and lower, the system is Dark Shot Noise dominant. The dashed black line representing Total Noise tracks with the green line representing Read Noise at low exposures and with the blue line representing Dark Shot Noise at longer exposures. Photon Shot Noise is negligible in this case. Such a system is NOT limited by the temporal uncertainty of the light itself in a manner similar to an Ideal camera, but by noise sources introduced by the camera. This non-ideal behavior applies to the entire range of exposures. One would typically want to avoid this by selecting a cooled camera with a much lower dark current.
To find the value of Photon Flux at which the system becomes Dark Shot Noise limited, we find the limiting case at which the Photon Shot Noise = Dark Shot Noise:
P*QE*t = Id*t => P = Id/QE
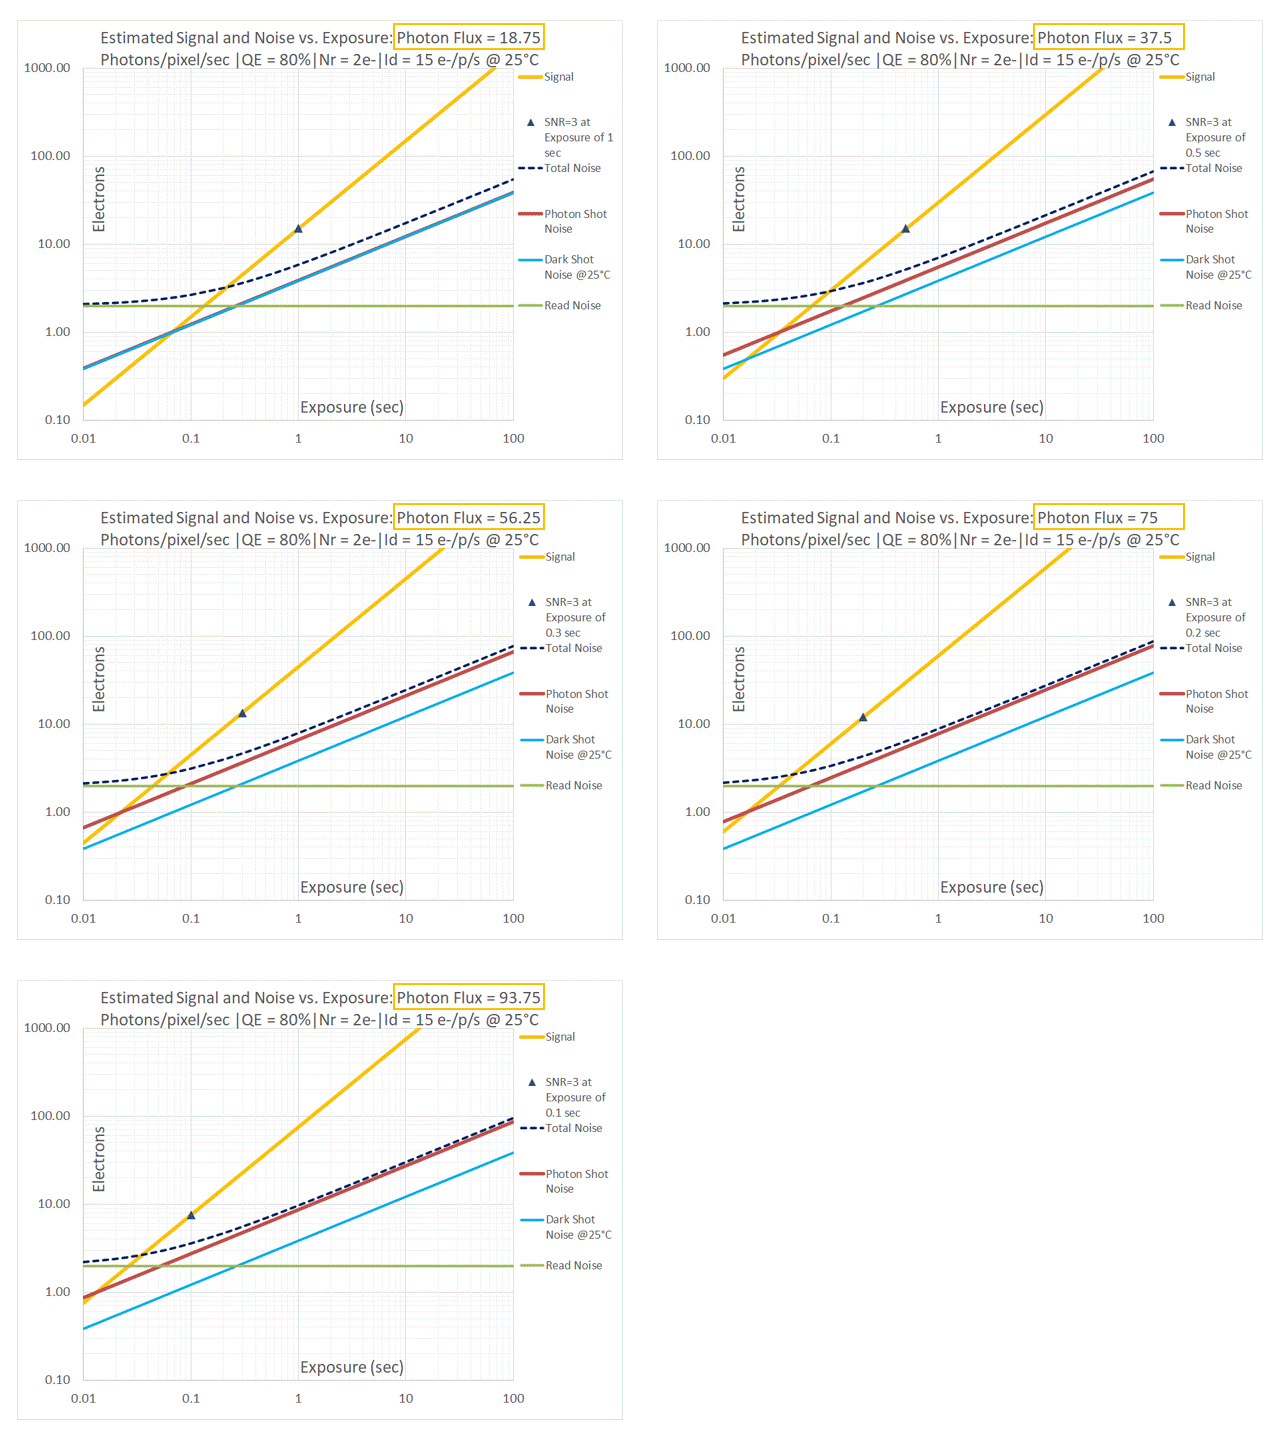
Using the values from our example: QE = 80%, Id = 15e-/p/s we can see that at P = 15/0.8 = 18.75 photons/pixel/sec, the Photon Shot Noise is exactly equal to the Dark Shot Noise. The red line and the blue line are therefore perfectly overlaid in the graph in the above sequence for a Photon Flux of 18.75 photons/pixel/sec (only the blue line is visible on the graph). Since noise sources add in quadrature, the system is already impacted by Dark Shot Noise when Photon Shot Noise is exactly equal to the Dark Shot Noise. This is indicated by the fact that the dashed black line representing Total Noise is already significantly separated from the blue+red line representing the overlaid two noise components. To prevent the highly non-ideal situation in which an imaging system is Dark Shot Noise limited, it is reasonable to apply a “factor of 3” as our selection criteria to avoid using a camera that is impacted by Dark Shot Noise. As shown in the graph for Photon Flux = 3 x 18.75 = 56.25 photons/pixel/sec, Dark Shot Noise is “safely” lower than Photon Shot Noise with a negligible contribution to Total Noise.
This gives us another figure-of-merit Ct which is particularly useful in comparing cameras for low-light, long exposure applications: Id/(a*QE), which is the Photon Flux Density (units: photons/sq-μm/sec) threshold below which the imaging system will be Dark Shot Noise dominant. Note that “a” the area of the pixel has now been factored in, so that we can tie this figure-of-merit to Photon Flux Density (units: photons/sq-μm/sec) instead of Photon Flux (units: photons/pixel/sec).
If the Photon Flux Density is less than the threshold Id/(a*QE), then Dark Shot Noise is the dominant source of noise at longer exposures. Under these circumstances, the system goes from being Read Noise limited to Dark Shot Noise limited – it is never Photon Shot Noise limited (recall that being Photon Shot Noise limited is the hallmark of an “Ideal” imager, and therefore represents the best possible situation for a given imager). To determine the exposure at which this transition occurs, we set Id*t = Nr2, from which we arrive at another figure of merit Co representing t = Nr2/Id. The coefficients Ce and Co represent the exposure threshold at which the system switches from being Read Noise limited to either Photon Shot Noise limited -or- Dark Shot Noise limited. It should come as no surprise that the coefficients Ce, Co and Ct are linked. In fact, a little algebraic substitution shows us that: Ct = Ce/Co.
At exposures values that exceed this threshold Co the system is Dark Shot Noise limited. We can now estimate the SNR for a Dark Shot Noise limited system:
SNR = Signal / Dark Shot Noise = P*a*QE*t/Sqrt(Id*t)
The above can be re-written as: SNR = P*(a*QE/Sqrt(Id))*Sqrt(t) for a Dark Shot Noise limited imaging system.
This gives us Cd, a coefficient equal to a*QE/Sqrt(Id) which, we can see by algebraic rearrangement, is the same as Cp/Sqrt(Ct). This coefficient can be used to estimate the SNRs of Dark Shot Noise limited imaging systems as SNR ≈ Cd*P*Sqrt(t), even though such systems are typically not desirable.
Figures of Merit (a list)
For our test imager, we can now list the figures-of-merit and observe their importance in camera selection. The pixels in our test imager are assumed to be 6.5μm x 6.5μm in size (area = a = 42.25 sq-μm), with a FWC = 48,000e–, a peak QE = 80%, Nr = 2e– and Id = 15e–/p/s. The figures-of-merit shown in this table are calculated at the peak QE which could occur at different wavelengths for different imagers. A similar calculation can be done using the QE values for specific wavelengths of interest, as demonstrated in the next article titled C18) Camera Selection – real world examples.
| Coefficient | Condition | Significance | Formula | Value (for test imager) | Usage |
| Cf | Bright light imaging | A measure of the maximum number of Photons that can be incident per sq-μm of the imager before it saturates | FWC/(a*QE) | 1420 | If we know the value of “P”, the Photon Flux Density in Photons/sq-μm/sec, we can estimate that the imager will saturate if the exposure “t” exceeds Cf/P seconds |
| Cr | Low light imaging | SNR Coefficient for Read Noise Limited systems | a*QE/Nr | 16.9 | To estimate SNR under low-light conditions multiply this coefficient with Photon Flux Density x Exposure |
| Ce | Crossover between Read Noise limited and Photon Shot Noise limited regimes | Transition between the two regimes occurs at this exposure for a Photon Flux density of 1 photon/sq-μm/sec | Nr²/(a*QE) | 0.12 | To estimate the exposure at which the transition from Read Noise limited to Photon Shot Noise limited imaging occurs, divide this coefficient by the Photon Flux Density |
| Cp | Bright light imaging | SNR coefficient for Photon Shot Noise limited systems | Sqrt(a*QE) | 5.8 | To estimate SNR under moderate-to-bright-light conditions, multiply this coefficient with the Sqrt of (Photon Flux Density * Exposure) |
| Ct | Dark Shot Noise limited | Photon Flux density must exceed this threshold value or the system will be Dark Shot Noise limited | Id/(a*QE) | 0.44 | To ensure that an imaging system NOT Dark Shot Noise limited, confirm that the Photon Flux Density exceeds this value by a sufficient margin |
| Co | Crossover between Read Noise limited and Dark Shot Noise limited regimes | Exposure threshold for Dark Shot Noise limited systems | Nr²/Id | 0.27 | If the system is Dark Shot Noise limited, this is an estimate of the exposure at which it transitions from Read Noise limited to Dark Shot Noise limited behavior |
| Cd | Dark Shot Noise limited | SNR coefficient for Dark Shot Noise limited conditions | a*QE/Sqrt(Id) | 8.7 | To estimate SNR under Dark Shot Noise limited conditions multiply this coefficient with Photon Flux Density * Sqrt(Exposure) |
The above table is a convenient way to distil the specifications of an image sensor into coefficients. This allows us to categorize and rank different imagers in terms of their photonics under typical conditions. Three coefficients (Cr, Ce, Cp) are usually sufficient to describe the low-light and bright-light conditions that are typically found in scientific imaging systems.
Of the remaining coefficients, Ct may be used by system designers to ensure that their imaging system is not Dark Shot Noise limited – a condition that should be avoided whenever possible. This condition can be met by considering only cameras for which the expected Photon Flux Density is sufficiently >> Ct. Thus coefficients Co and Cd are rendered irrelevant and the remaining cameras can be ranked & selected on the basis of their Cr, Ce and Cp coefficients.
The methods used for estimating or measuring the Photon Flux Density vary with the types of application, for which one can construct a “Photonics Budget”. In fluorescence microscopy, the Photon Flux Density at the imager plane depends on the excitation, the parameters of the fluorophores used, as well as the light collection efficiency and losses in the image formation path of the microscope. Please contact us if you have questions related to this topic.
Note: our method assumes that EITHER Photon Shot Noise OR Dark Shot Noise (but not both) are of significant magnitude in a particular situation. It is a reasonable approximation, particularly based on a recommendation that the Photon Flux Density is sufficiently >> Ct. This ensures that an imaging system is not Dark Shot Noise limited.
In the next section, we will seek validation for our approximations by checking if they come close to the estimated SNR curves that are derived from the more complete equations. We will also take note of the conditions under which they are valid. With this knowledge, we can use our coefficients for categorizing and ranking real-world cameras with respect to their photonics.
Validating the model
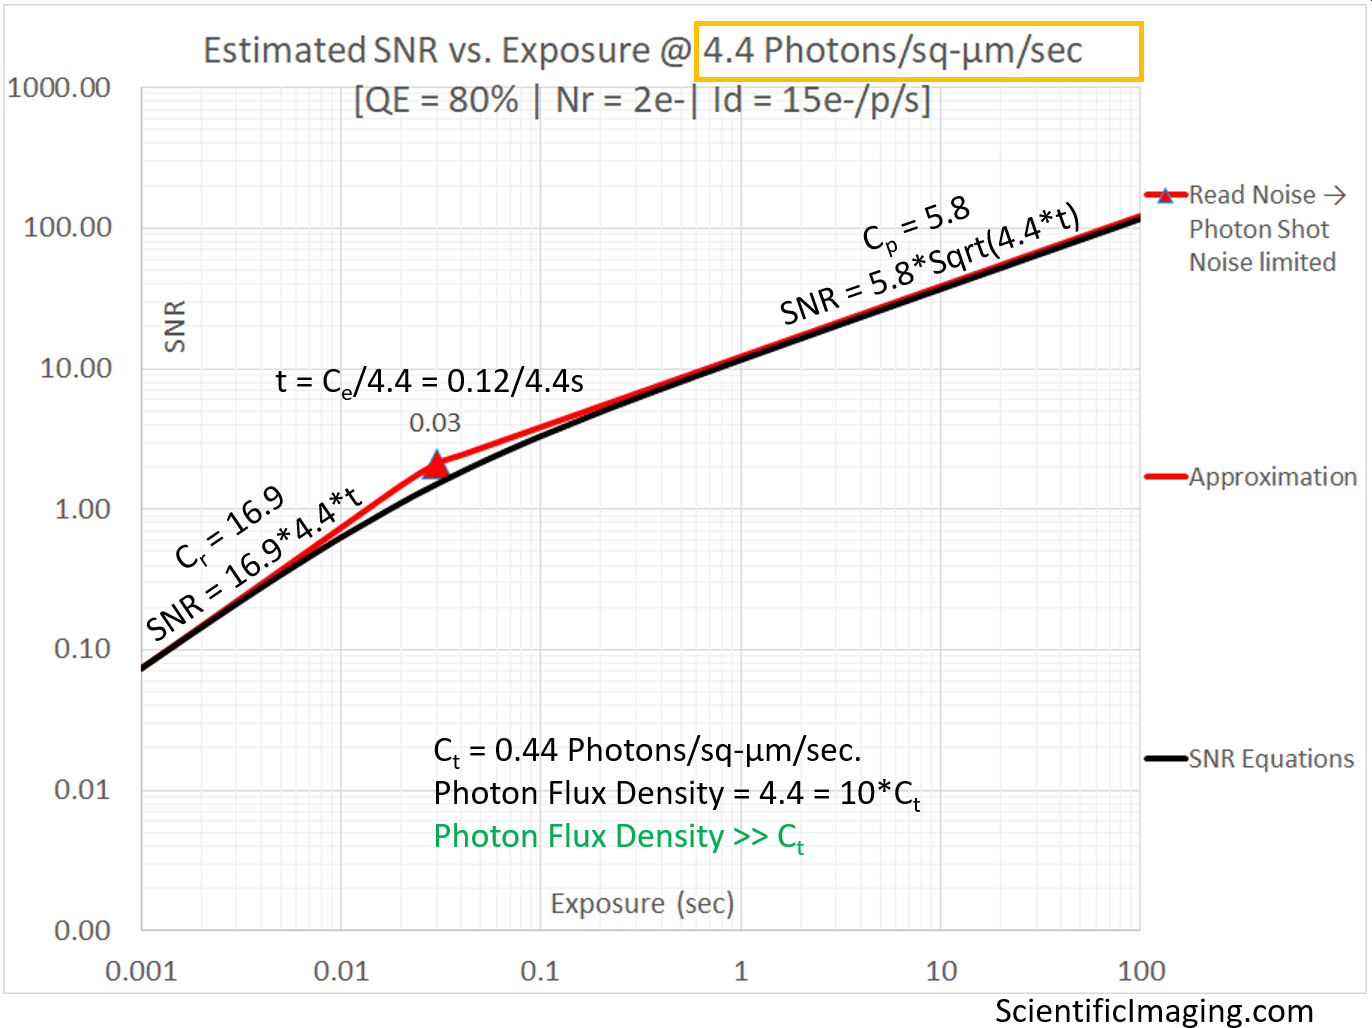
The above graph represents a desirable condition in that the system should not be impacted by Dark Shot Noise and can therefore be accurately represented by the red line representing the Read Noise limited condition on the LHS of the graph and the red line representing the Photon Shot Noise limited condition on the RHS of the graph. The SNR approximation obtained by using the coefficients Cr and Cp are a good match (in their respective regimes) to the estimates obtained from the more complete SNR equation which is shown as a black curve on the above graph. The two red lines intersect at an exposure that is the coefficient Ce is divided by the Photon Flux Density. This is a good estimate for the exposure duration “t” at which the system transitions from being Read Noise limited to being Photon Shot Noise limited.
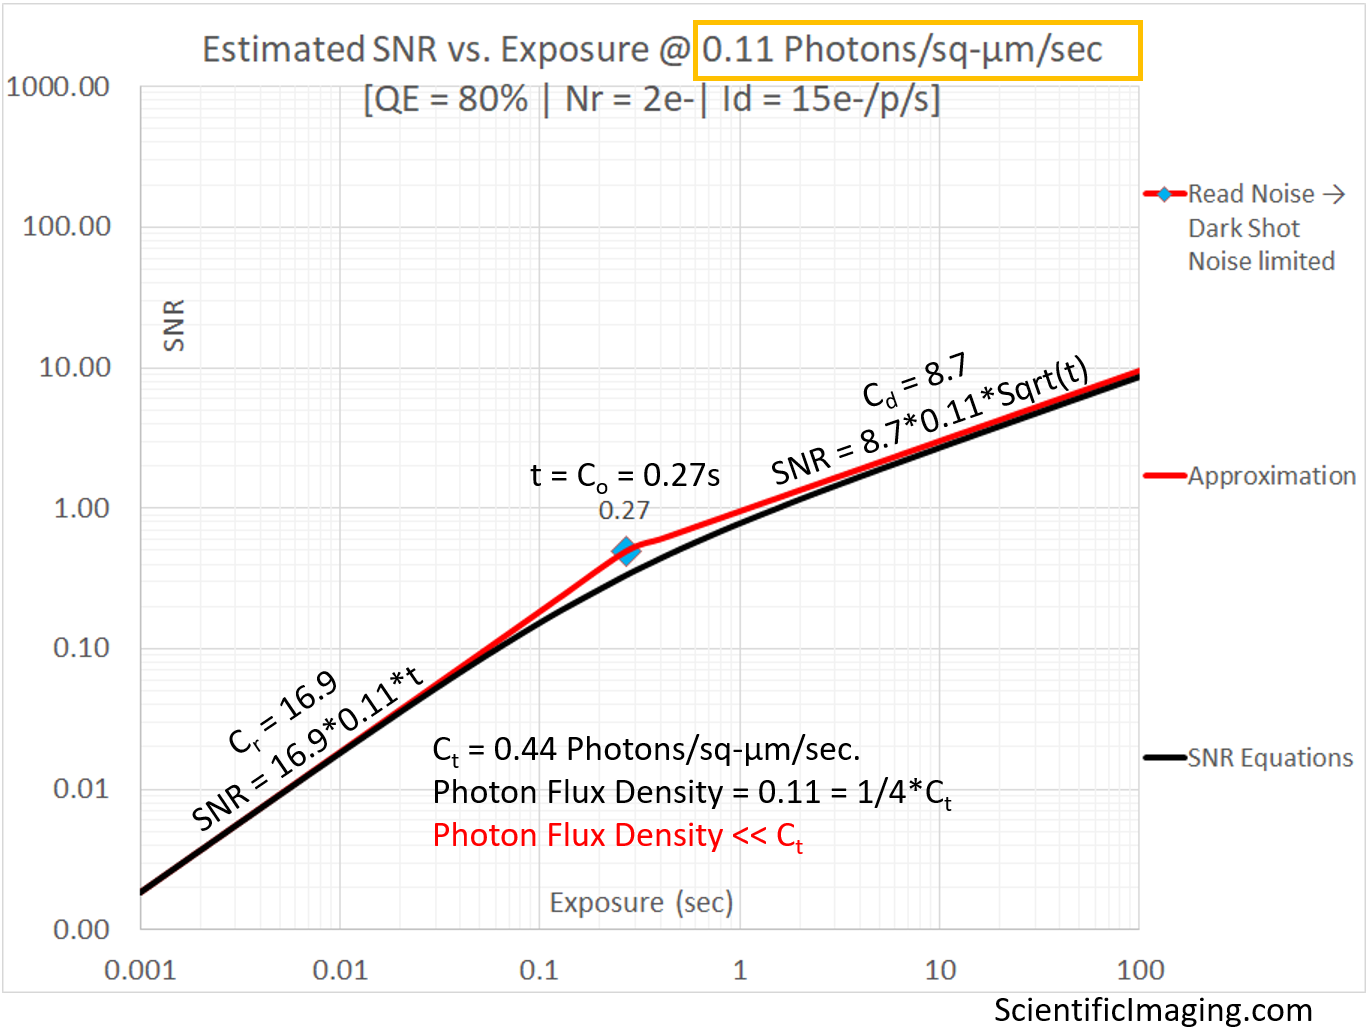
Even though the above graph represents an undesirable Dark Shot Noise limited condition, it can be accurately represented by a Read Noise limited red line on the LHS of the graph and a Dark Shot Noise limited red line on the RHS of the graph. The SNR approximation obtained by using the coefficients Cr and Cd are a good match (in their respective regimes) to the estimates obtained from the more complete SNR equation. The two red lines intersect at an exposure for which the coefficient Co provides a good estimate. This is the exposure duration “t” at which the system transitions from being Read Noise limited to being Dark Shot Noise limited. No matter what the exposure of the camera is, it never reaches the desirable state of being Photon Shot Noise limited.
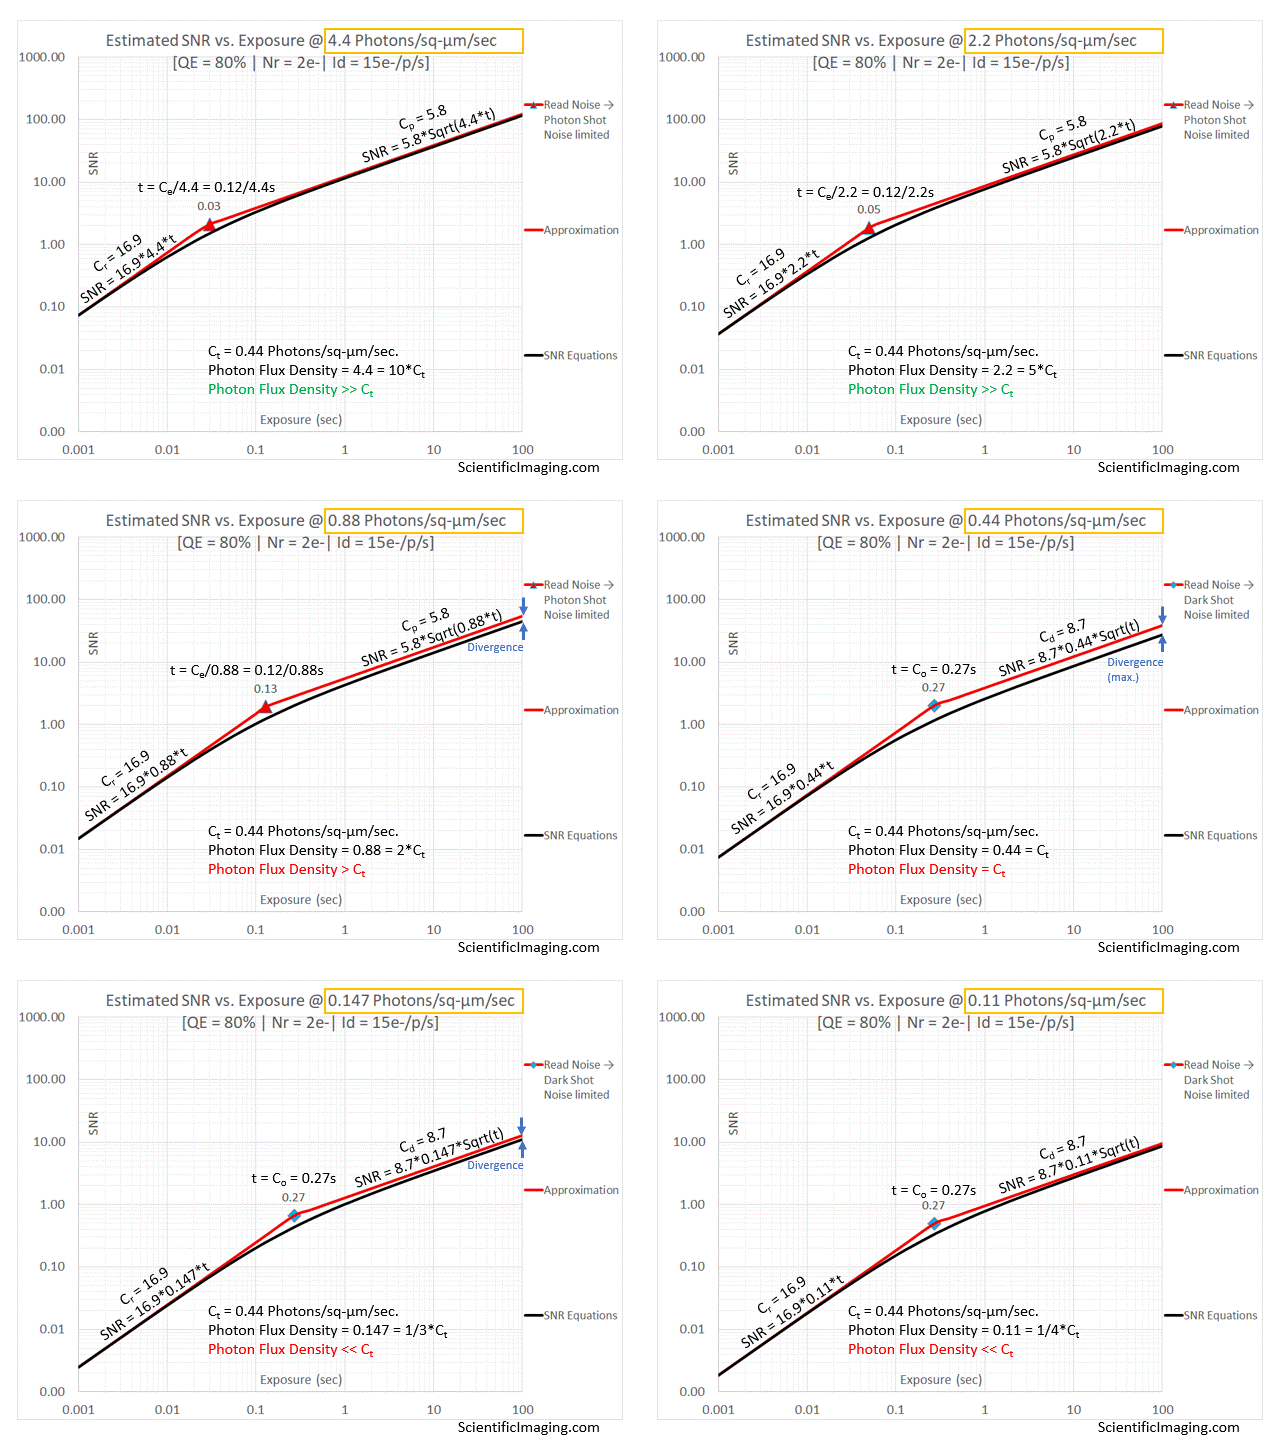
The approximation tracks the SNR estimate from the more detailed analysis for Photon Flux Densities that are 3~5x Ct and higher, essentially covering the recommended range of operation. We observe some divergence as the Photon Flux Density approaches Ct. Maximum divergence occurs when Photon Flux Density = Ct. This is due to the fact that at these levels of Photon Flux Density both Photon Shot Noise and Dark Shot Noise have similar magnitudes (which add in quadrature). The approximation takes the larger of {Photon Shot Noise & Dark Shot noise} into account, assuming the other to be negligibly small. This assumption is true for most of the range of Photon Flux Densities, but not when Photon Shot Noise and Dark Shot Noise are of roughly the same order of magnitude.
As Photon Flux Density is lowered below Ct, the Photon Shot Noise becomes negligibly small, while the Dark Shot Noise remains constant and becomes the dominant noise source. Therefore, the divergence between the SNR approximation and the SNR estimated by the more detailed method starts to shrink for lower values of Photon Flux Density. The approximation tracks quite well for Photon Flux Densities that are much smaller than Ct, when the imager would be severely Dark Shot Noise limited. Since one would typically avoid selecting a camera if the Photon Flux Density is not at least 3~5x the Ct for a particular camera, the divergence is not very relevant to real-world camera selection.
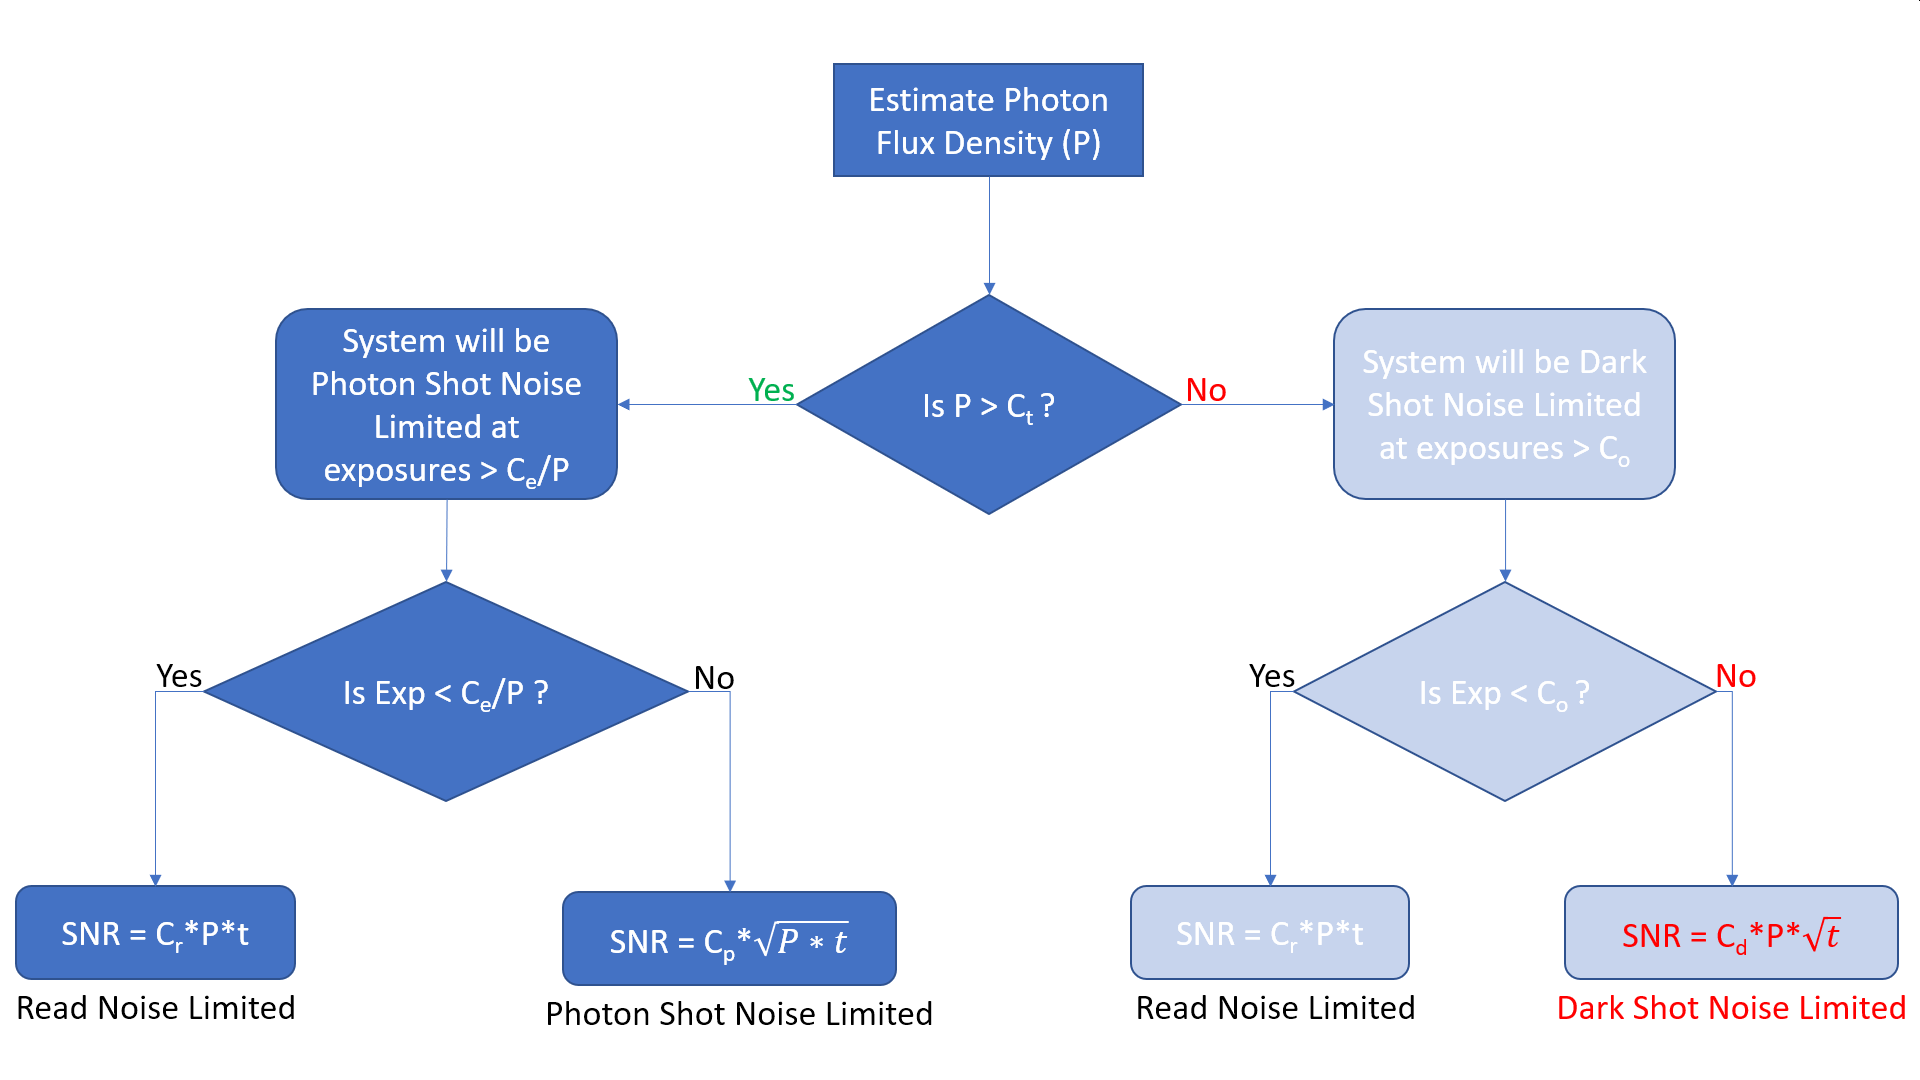
A Flowchart for SNR estimation
Applying the approximations to real-world cameras
Now that our method is validated for the entire recommended range of operation, we are in a position to apply it to the camera selection process. In the next article, we will use this simplified approach to estimate and rank the photonics of specific CMOS and sCMOS cameras under different conditions. Our goal is to make the selection process as objective as possible.
Although the approximations are valid and very useful in objective and efficient comparisons for the purposes of camera selection, our coefficients can also be used to estimate a more accurate value for SNR. We can arrive at the more complete equation by taking Equation #6 and re-arranging it in terms of these coefficients:
SNR = P*a*QE*t/Sqrt(P*a*QE*t + Nr2 + Id*t) ——————– [Equation #6]
If we divide the numerator and denominator by Sqrt(a*QE) and perform a little algebra, while substituting our coefficients in the resulting equation, Equation #6 simply becomes:
SNR = Cp*P*t/Sqrt(P*t + Ce + Ct*t) with the terms in the denominator representing Photon Shot Noise, Read Noise and Dark Shot Noise respectively.
To show that this gives us the same approximations in situations in which a particular noise-source is dominant and others are negligible in comparison:
If Read Noise is dominant: SNR ≈ Cp*P*t/Sqrt(Ce), which, since Cr = Cp/Sqrt(Ce), can be re-written as SNR ≈ Cr*(P*t)
If Photon Shot Noise is dominant: SNR ≈ Cp*P*t/Sqrt(P*t), which can be further simplified to SNR ≈ Cp*Sqrt(P*t)
If Dark Shot Noise is dominant: SNR ≈ Cp*P*t/Sqrt(Ct*t), which can be simplified to SNR ≈ Cp*P*Sqrt(t)/Sqrt(Ct). Since Cd = Cp/Sqrt(Ct), this can be re-written as SNR ≈ Cd*P*Sqrt(t)

