In this article, we dig a little deeper into the features and benefits of specific Back Side Illuminated (BSI) sCMOS cameras. For an overview of the main differences between BSI and conventional Front Side Illuminated (FSI) imagers, please check out the article titled “Front Side Illuminated and Back Side Illuminated imagers“. The key difference in terms of specifications is that BSI sCMOS imagers typically have significantly higher QE (peak QE ≥ 90%) than conventional FSI imagers (peak QE ≤ 80%). For this reason they are a good choice in low-light imaging applications.
The following table shows a selection of sCMOS cameras with BSI imagers, with their salient specifications:
** Peak QE is shown for monochrome versions of each camera series (see QE Curves below). Max frame rate is displayed as max frame rate at full resolution.
QE Curves
The following is an interactive plot of the QE curves for cameras based on BSI sCMOS imagers. They are shown on one graph so that it is possible to make comparisons. The following interactive features of this graph can be helpful:
- Use your mouse to hover over the legend of a particular camera to see it highlighted in the graph below.
- Click on the legend of a camera to turn on or off its plot.
- Use your mouse to read QE data for all displayed imagers at the wavelengths of interest.
- Right-click and drag to zoom-in along the X-axis to expand the view for a desired range of wavelength.
- To pan left or right within a zoomed-in view, hold down the Shift key and use your mouse.
- To revert from the zoomed-in view to the normal view, click on the “Reset zoom” button that is displayed at the top-RHS of the graph.
These graphs are an estimate of the spectral response of commercially available cameras that are based on BSI sCMOS imagers. This information is provided for reference purposes only and should not be used as a guarantee of performance.
Camera Selection, simplified
The next table shows the same sCMOS cameras with BSI imagers, detailing their respective Figures of Merit (which were defined in the article titled “Camera Selection, simplified“. As described in the linked article, two coefficients (Cr, Cp) are usually sufficient to describe the low-light and bright-light conditions that are typically found in scientific imaging systems. This reduces the complexity of making camera comparisons to that of comparing TWO figures-of-merit for image quality (SNR) that relate directly to low-light and bright-light imaging. These figures-of-merit (with Ce included for completeness) are highlighted in yellow on the table-header below. The figures of merit are easy to calculate from information that is readily available on camera data sheets. For this table, a Photon Flux Density of 1.0 photons/sq-μm/sec is assumed, which reduces Ce/P to Ce. Peak QE values were used on this table – similar calculations can be performed at any specific wavelength of interest.
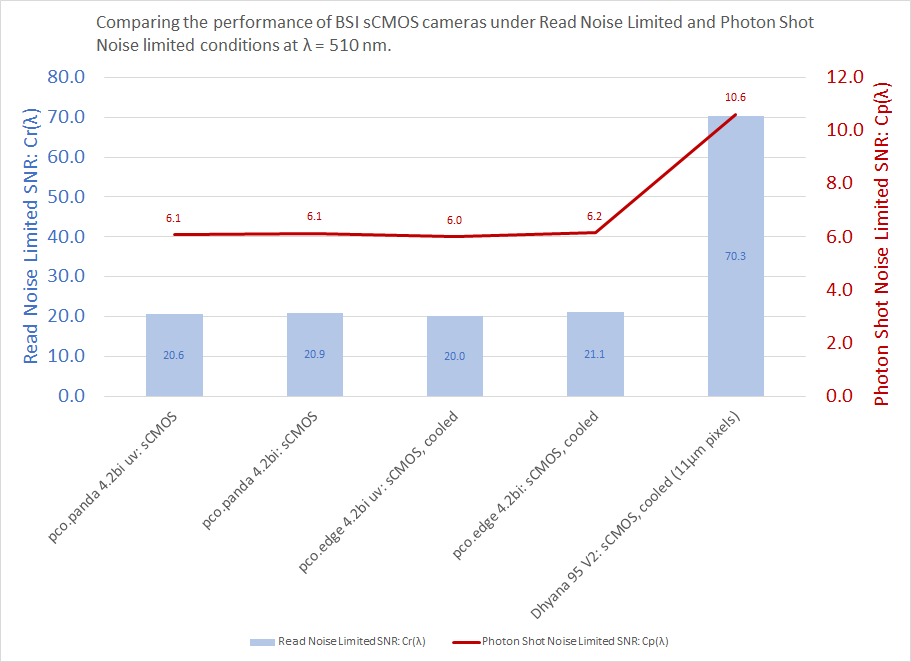
The following is a graph of the two most important coefficients, Cr and Cp at a wavelength of 510nm (which is why the coefficients are slightly different from those based on Peak QE values in the above table). The two coefficients provide an easy way to compare the estimated image quality (represented by SNR) in low-light and bright-light imaging applications. A wavelength of 510nm was selected because it is close to the emission wavelength of GFP, a fluorophore that is used in many fluorescence microscope imaging experiments. Similar comparisons can be performed at different wavelengths of interest. The benefit of using a camera with larger pixels is also noticeable: the cooled Dhyana 95 V2 camera has similar QE and Read Noise as the other BSI sCMOS cameras, but its large 11µm pixels make quite a difference!
HDR: High Dynamic Range readout
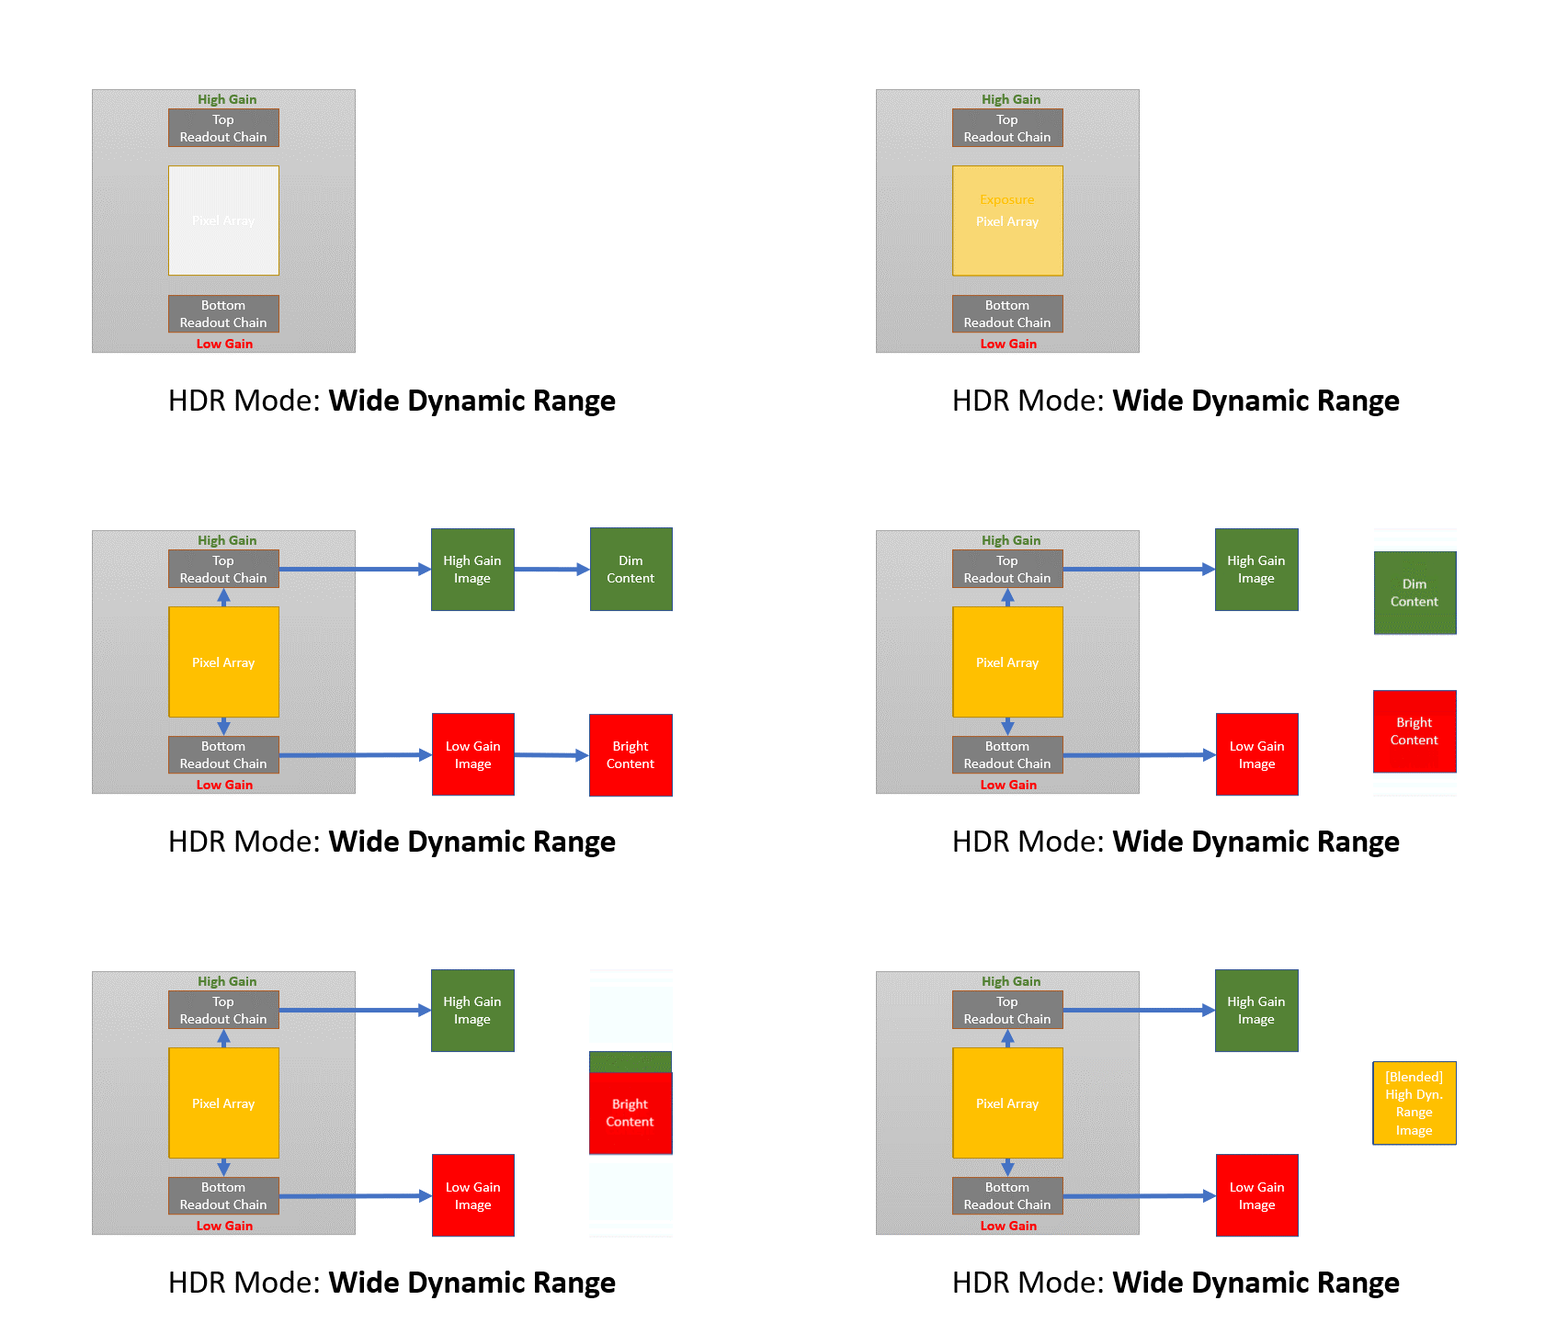
The BSI sCMOS cameras mentioned in this article have two readout and Analog-to-Digital (A/D) conversion datapaths, shown below as “Top” and “Bottom” readout chains. These pixel values in the two datapaths result from the same exposure.
In the High Dynamic Range (HDR) mode, different analog gains are applied to the Top and Bottom readout chains: the low gain image is optimized for high full well capacity, and the high gain image is optimized for low read noise. The animation below shows the typical HDR mode of operation in which the low-gain and high-gain datapaths are combined. Data from the dimmest content as well as the brightest content are blended in a way to achieve an image with a high intra-scene dynamic Range.
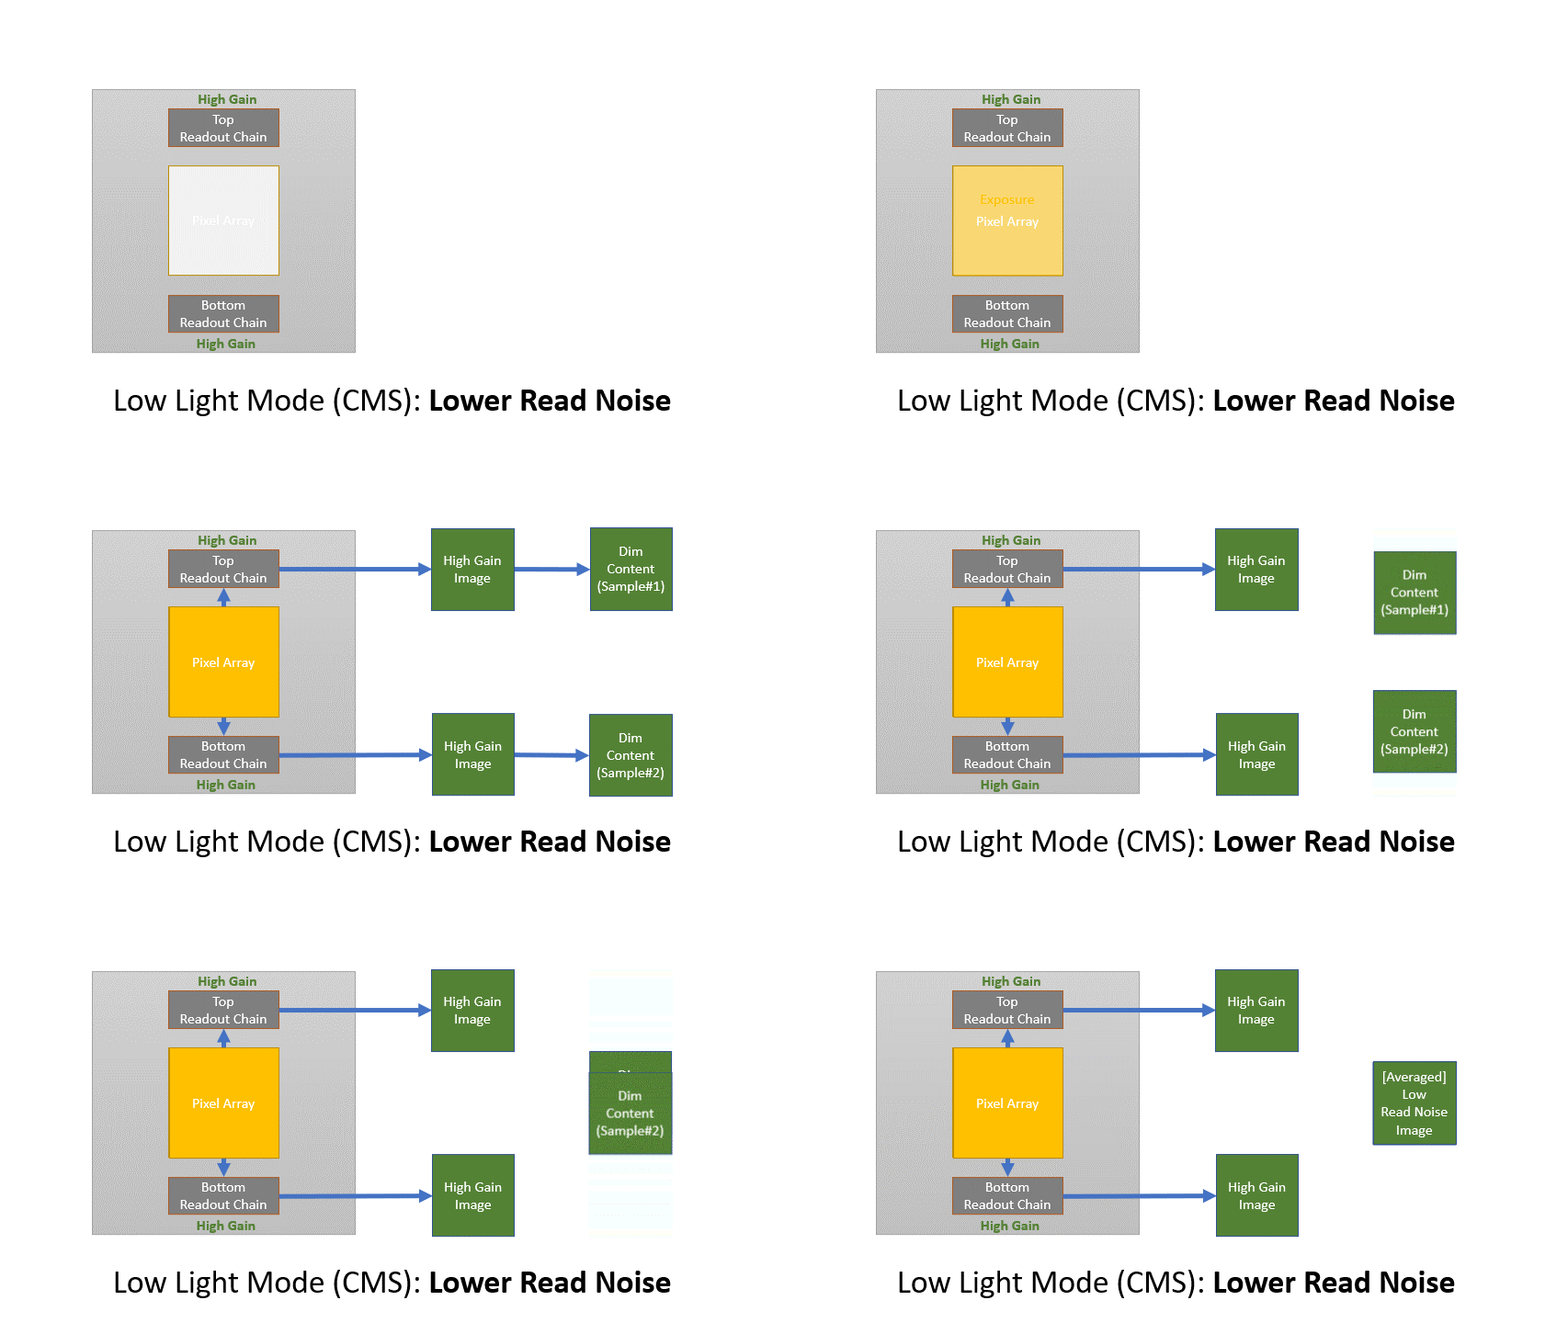
Low-light readout mode
The TE-cooled pco.edge 4.2bi & pco.edge 4.2bi uv and the non-cooled pco.panda 4.2bi, pco.panda 4.2bi uv also offer a low light mode in which the top and bottom datapaths are both set to high gain, which means that both A/D converters on the image sensor digitize low intensity pixel values, optimized for low read noise. The signal within each pixel is simultaneously digitized by the two A/D converters and added – a technique that is referred to as correlated multi sampling (CMS). This causes a reduction of the read noise, the trade-off being that the usable intra-scene dynamic range of the sensor is reduced in comparison with that achievable in the HDR mode. This is usually not a concern under low light conditions, but one must be aware of the reduction in the effective Full Well Capacity (FWC) in this mode as shown in the camera datasheets. Sampling theory estimates a noise reduction by a Sqrt(2) factor: for camera specific details, see the individual datasheets via the above links.
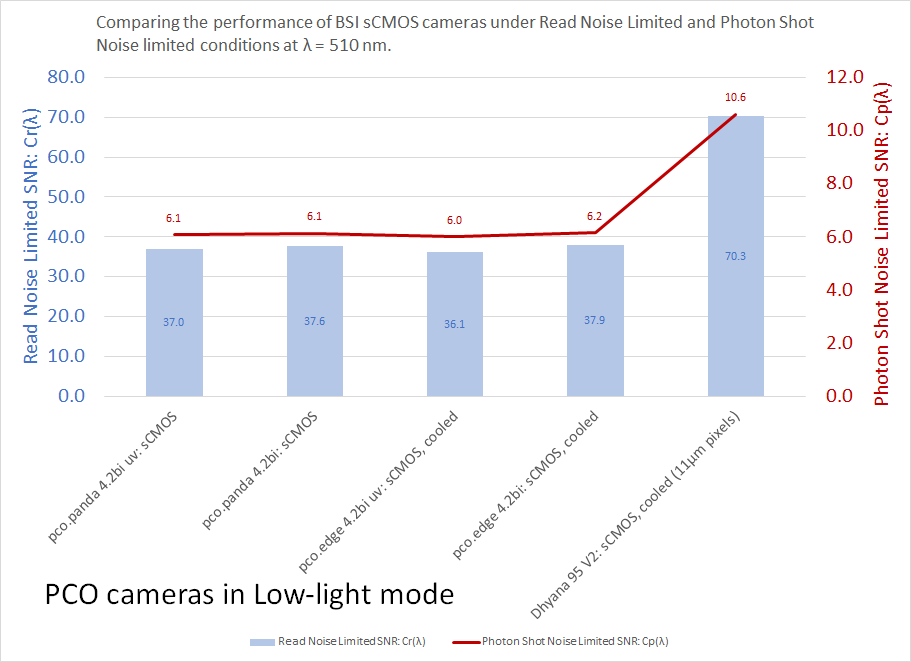
The Low Light Mode lowers the effective read noise by Sqrt(2), and this provides a significant boost in the low-light imaging characteristics of the cameras with this feature. This can be seen in the graph below: the values of Cr are much higher than those in the the graph above that shows the same coefficients. Cp is unchanged, since Photon Shot Noise limited performance is independent of Read Noise.
Estimating Camera Performance in Low-light mode
The following graph sequence shows the benefit of using the Low Light Mode (CMS) under imaging conditions in which the Photon Flux density is low. Using the method that was described in the article “Estimating Camera Performance” we show the plot of the estimated SNR vs Exposure at different levels of Photon Flux density. For this example, we have chosen QE values at λ = 510nm, a wavelength of interest in many low-light fluorescence microscope imaging applications.
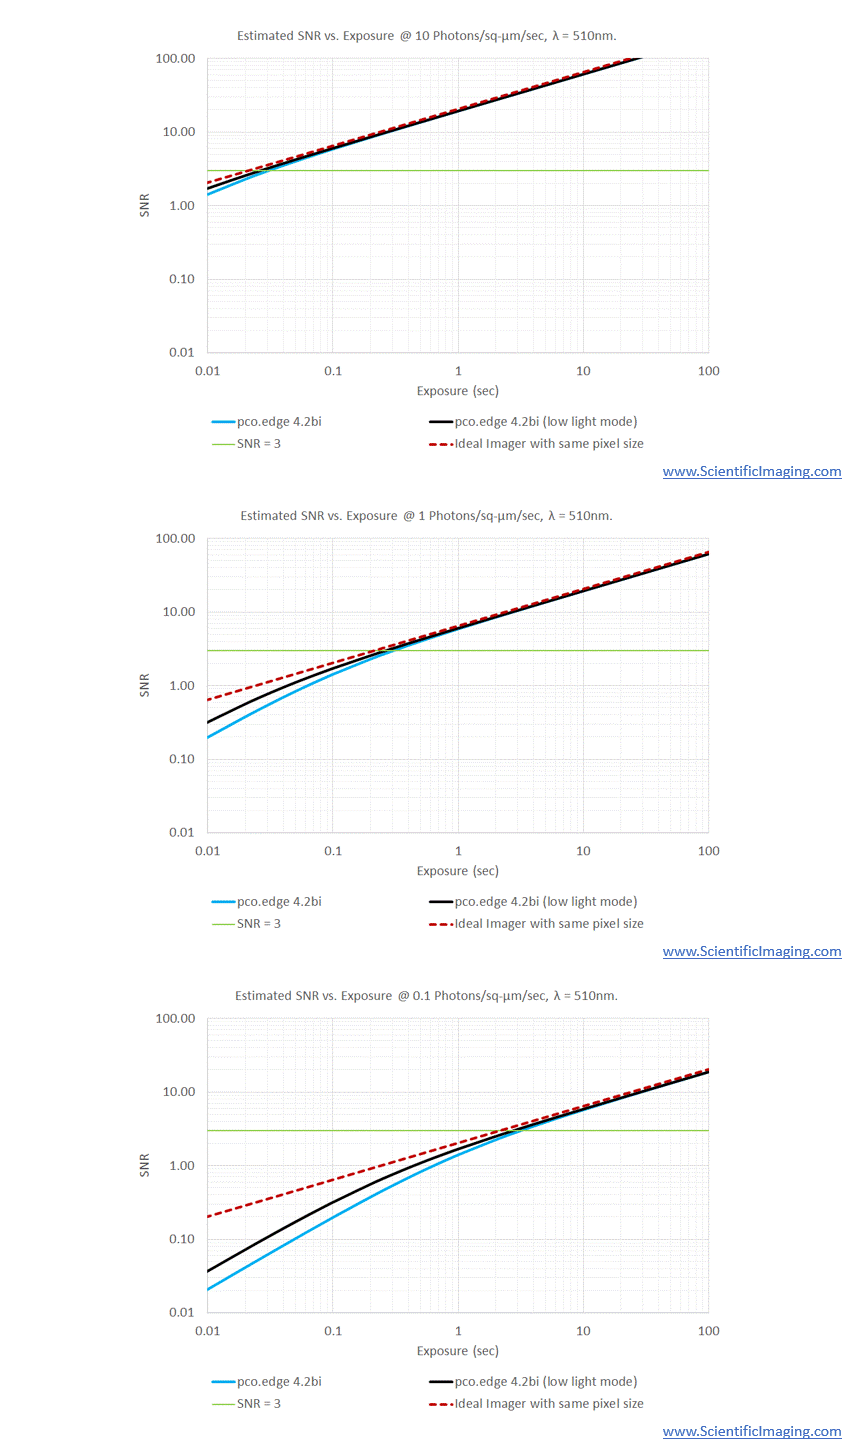
The TE-cooled pco.edge 4.2bi camera is shown as a representative example, although a similar benefit could be shown for the non-cooled pco.panda 4.2bi. The same applies to the UV versions in both camera series, the cooled pco.edge 4.2 bi uv and the non-cooled pco.panda 4.2 bi uv.
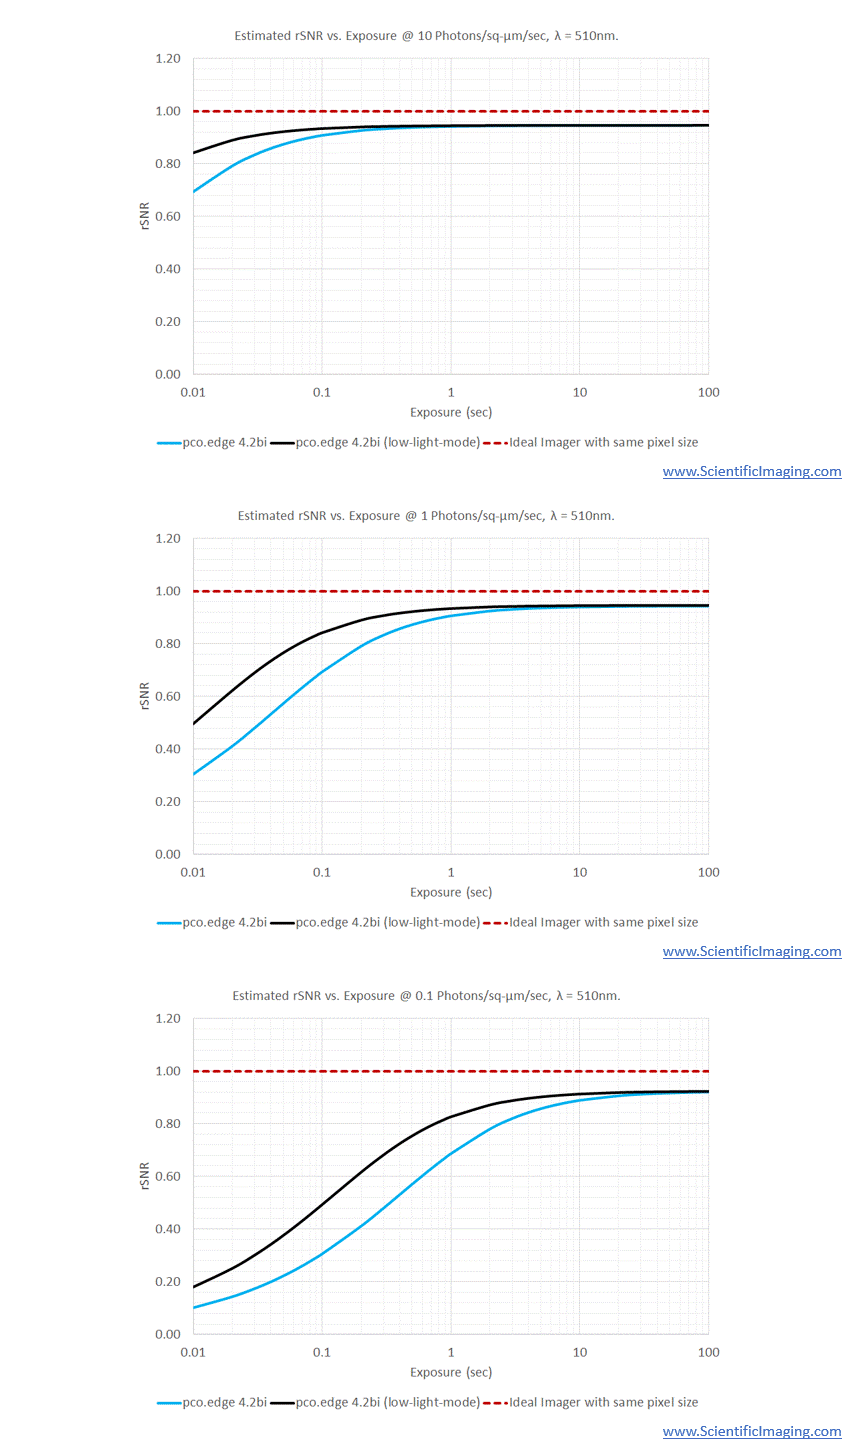
The dotted red line represents the estimated performance of an ideal imager with the same pixel size. This is shown for reference, since it shows the maximum (theoretical) SNR that can be achieved with a given Photon Flux Density & exposure when only Photon Shot Noise is factored in.
As expected, the improvement in SNR is observed in the read-noise limited region which represents the LHS of the above graph. The Photon Shot Noise limited region towards the RHS of the above graph is unchanged, since the SNR in that region is not impacted by read noise. The same information that is presented in the above graph sequence is shown below in terms of Relative SNR, normalized with respect to the ideal imager with the same pixel size.
Please contact us for assistance in the process of matching the right imager with the requirements of your application. As detailed in the list of prioritized criteria for Scientific Camera selection, it is important to prioritize photonics performance as the first step in the camera selection process.

