In this article we attempt to segment the various types of imaging applications that rely on spectral information. These terms are used somewhat loosely and interchangeably in the industry, but they describe categories of imaging techniques with different levels of spectral resolution, i.e. the number of bands of wavelengths are different across the categories.

- Spectral Imaging
Spectral imaging, also known as monochromatic or single-band imaging, captures an image at a specific wavelength or within a narrow band of wavelengths. This technique is often used in scientific research and industrial applications that require precise control over the wavelength of light. Some common examples include:
- Fluorescence microscopy: Spectral imaging is employed to distinguish between multiple fluorescent labels in biological samples.
- Astronomy: Astronomers use spectral imaging to analyze the light emitted or reflected by celestial objects, helping them determine composition, temperature, and other properties.
- Materials analysis: Spectral imaging can identify specific materials based on their spectral signatures, making it useful in quality control and material identification. For example, since Silicon is transparent above 1110nm, one may use an InGaAs camera with a bandpass filter at ~1200nm to “see through” silicon.
- Multispectral Imaging
Multispectral imaging captures images at several discrete wavelengths or within a few broad spectral bands. This technique provides more information than spectral imaging, as it can discriminate between different materials and features based on their spectral characteristics. Multispectral imaging is widely used in various applications, such as:
- Using an RGB color camera is a form of multispectral imaging, since the camera captures three bands of wavelengths that we identify as Red [620 – 750nm], Green [495 – 570nm] and Blue [450 – 495nm]
- Agriculture: Monitoring crop health, assessing soil properties, and detecting diseases in plants.
- Remote sensing: Analyzing Earth’s surface for environmental monitoring, land use classification, and mineral exploration.
- Medical imaging: Identifying and characterizing tissues and anomalies in the human body.
- Satellite imagery: Gathering data for climate studies, natural disaster monitoring, and urban planning.
- Hyperspectral Imaging
Hyperspectral imaging takes spectral analysis to the next level by capturing images at hundreds or even thousands of narrow, contiguous spectral bands across a wide range of wavelengths. This technique offers an unprecedented level of detail and is often used for applications requiring fine discrimination of materials and features. Some notable uses of hyperspectral imaging include:
- Mineral exploration: Identifying valuable minerals based on their unique spectral signatures in geological surveys.
- Environmental monitoring: Detecting pollutants, monitoring vegetation health, and assessing water quality.
- Food quality control: Identifying contaminants, assessing freshness, and ensuring product consistency.
- Remote sensing: Mapping land cover, detecting hidden archaeological sites, and monitoring ecosystems with high precision.
Key Differences
To summarize, here are the key differences between spectral, multispectral, and hyperspectral imaging:
- Spectral Imaging:
- Captures images at a single specific wavelength or a narrow band.
- Used for precise wavelength control and analysis in research and industrial settings.
- Multispectral Imaging:
- Captures images at several discrete wavelengths or broad spectral bands.
- Provides enhanced material discrimination and is widely used in agriculture, remote sensing, and medical imaging.
- Hyperspectral Imaging:
- Captures images at numerous contiguous spectral bands across a wide range of wavelengths.
- Offers fine material discrimination and is used in applications requiring high spectral detail, such as mineral exploration and environmental monitoring.
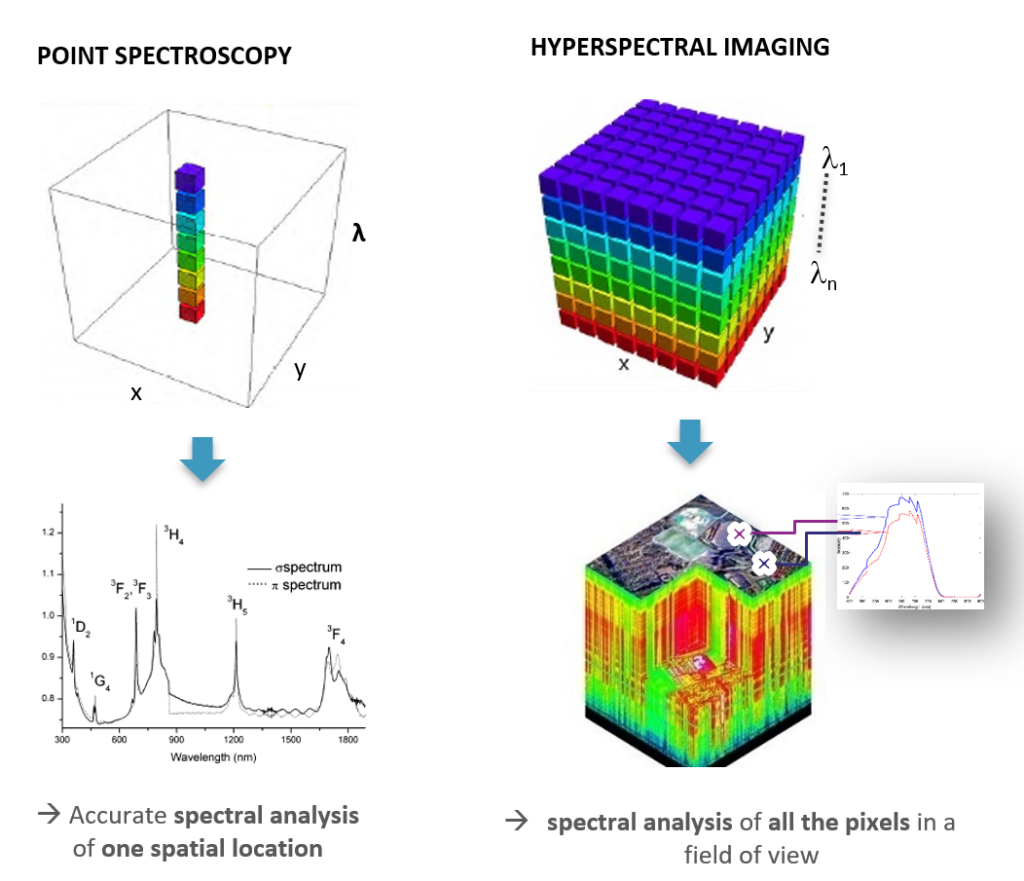
A hyperspectral image is a set of image layers, with each layer representing the spatial intensity distribution at a particular wavelength. This data can be represented as a λ-axis that is orthogonal to the conventional (x,y) axes used to spatially represent image data. The combination of all the acquired spectral layers is called a hyperspectral data cube.

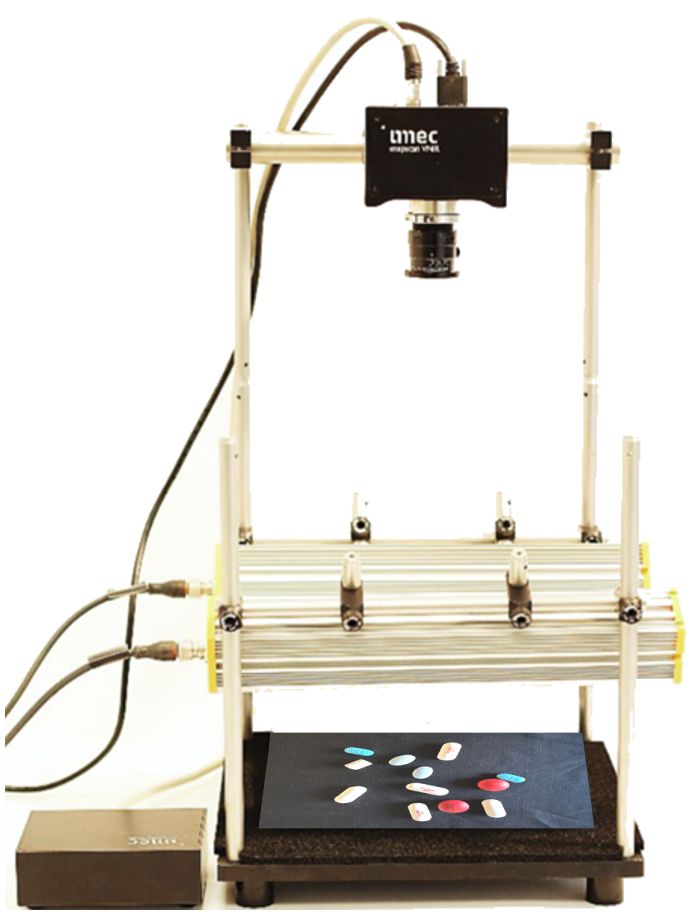
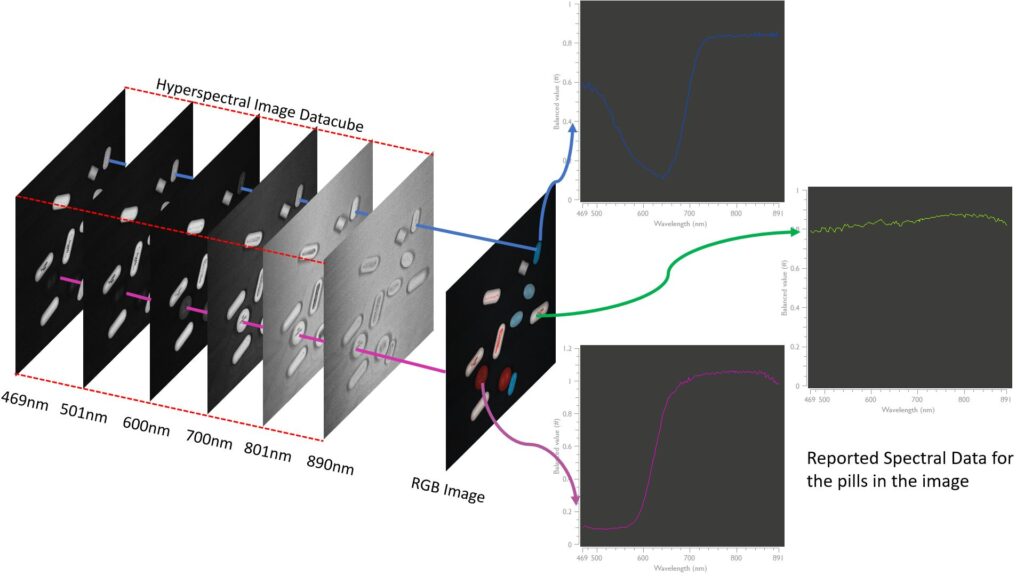
A graphical representation of a real-world X:2048 x Y:2048 x λ:150 data cube from a pharmaceutical pill inspection demo is shown in the sketch below. The hyperspectral data cube was captured using a Snapscan VNIR camera with a c-mount f=35mm lens installed. The camera was mounted with the lens pointing downwards, capturing a field of view of roughly 200mm x 200mm. The samples were commonly found household pharmaceutical pills marked “Tylenol”, “Aleve” etc. that were red, blue and white in appearance. The sample plane was uniformly illuminated using LED bars with a broadband spectral output. A camera exposure of 1.5ms was sufficient to capture images under these illumination conditions. It took about 20 seconds to capture a X:2048 x Y:2048 x λ:150 data cube.
Only six of the ~150 planes are shown in the Hyperspectral Image Datacube below, the rest are omitted for clarity. A conventional RGB image is shown for reference, showing the locations of the red, blue and white pills in the image.

It is useful to examine the values on all of the 150 spectral planes at the same pixel location (essentially looking through the 3-dimensional stack of images at a particular pixel location). An intensity vs. wavelength plot of these values would give us the spectral distribution for that particular pixel location, a “spectrographic” view of the light collected from the area represented by that pixel in the field of view. This is shown graphically above, where the blue, green and purple lines passing through the spectral planes connect to the graphical [intensity vs wavelength] representations at their respective pixel locations.
Applications involving the use of such spectral AND spatial data from different types of samples (in pharmaceutical products, metallurgy, agriculture, food, etc) will be detailed in subsequent articles. The main takeaway from this discussion is that one may conceptualize a hyperspectral data cube as a spectrographic dataset for each spatial location represented by a pixel in the field of view. An X:2048 x Y:2048 x λ:150 data cube effectively represents data captured by > 4 million spectrometers, with intensity values of a particular pixel location at 150 different wavelengths.

In the next article, titled “Multispectral/Hyperspectral Imaging Techniques” we take a deeper dive into the different types of solutions that are available.

