The previous article “M12) Qualitative Phase Imaging Microscopy” described qualitative imaging techniques such as Phase Contrast Microscopy and Differential Interference Contrast (DIC) Microscopy that are widely used for label-free high-contrast imaging of transparent live-cells. In these techniques, the phase shift Φ that occurs as light passes through such samples is converted into intensity differences. While these techniques don’t quantify the phase shift, they use interference-based methods to enhance the intrinsic contrast in live-cells. These techniques are widely used because they enable insight into unstained transparent objects to improve the visualization of the samples. However, they don’t provide quantitative information about the samples.
In this article, we discuss techniques that quantitatively measure phase information from which biologically significant properties of live cells may be inferred. These techniques belong to the category of Quantitative Phase Imaging (QPI), a label-free approach to obtaining quantitative information related to cells and tissues. QPI techniques are label-free and non-destructive and therefore can be used for long-period live-cell imaging without photo-toxicity or photobleaching. Multiple cellular characteristics can be measured repeatedly over time in longitudinal studies. These capabilities open new opportunities to study long-term cellular events such as proliferation and response to chemical stimulations.
Theory
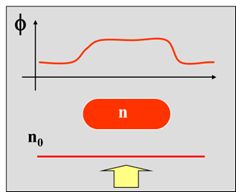
As introduced in the previous article, transparent “phase objects” such as live cells don’t absorb, reflect or scatter light significantly. However, changes in their refractive index and thickness result in a slight delay in the phase of light passing through them. Such objects don’t significantly change the amplitude or intensity of the light, but they cause a phase shift Φ, or an optical pathlength (OPL) change.
Unlike qualitative phase imaging that only use the phase shift to improve the visualization of the label-free live cells, in QPI the phase shift Φ is measured and converted to useful information such as local thickness, refractive index or dry mass (non-aqueous material content). From this data, we can infer biologically relevant information about how cells grow, produce proteins etc.

A QPI image captures the spatial map of the pathlength shifts associated with the specimen. In addition to showing the intrinsic contrast, the pixel data is representative of the time-delay, that is the time taken by light to propagate through the sample at each point in the field-of-view. It contains information about the local thickness and refractive index of the structure. The image shown on the LHS is a quantitative phase image of a hippocampal neuron: the color bar indicates the optical path length in nanometers.
QPI combines interferometry and holography. Known phase differences are introduced in an interferometer between the reference (un-scattered) and sample (scattered by the phase object) beams. The resulting interferograms/holograms (intensity images) are used to extract a quantitative map of specimen phase shifts with intrinsic contrast (without the need for tagging or staining).
![]() h / λ – where n and n0 are the refractive indices, h is the local thickness and λ is the wavelength of light.
h / λ – where n and n0 are the refractive indices, h is the local thickness and λ is the wavelength of light.
If the refractive indices n and n0 are known, then the phase difference measurement allows us to quantitatively estimate differences in thickness, thus providing topographical information about the samples. This can be used to create accurate 3D models of organelles and cells.
If the local thickness h is known, then the phase difference measurement allows us to quantitatively estimate Δn (refractometry).
The above equation may be recast in terms of the refractive index increment 𝛾 and the dry mass 𝜌 , i.e. the non-aqueous content.
![]() / λ
/ λ
If the refractive index increment 𝛾 is known, then the phase difference measurement allows us to quantitatively estimate the dry mass 𝜌. QPI has the ability to quantify live cell growth with femtogram sensitivity and without contact.
References:
- Quantitative Phase Imaging of Cells and Tissues (McGraw-Hill Biophotonics) by Gabriel Popescu.
- Quantitative phase imaging in biomedicine: YongKeun Park, Christian Depeursinge & Gabriel Popescu (Nature Photonics 2018)
- Spatial light interference microscopy: principle and applications to biomedicine: Xi Chen, Mikhail E Kandel, Gabriel Popescu
QPI modalities can be broadly categorized as interferometric and non-interferometric, depending on whether an interferometer is involved in the phase measurement. Non-interferometric methods include ptychography and wavefront sensing, such as the Shack–Hartmann wavefront sensor, which is broadly employed in the field of adaptive optics. Other interferometric phase measurements include scanning techniques, such as optical coherence tomography (OCT). This article will focus on full-field QPI methods based on temporal phase modulation (phase-shifting interferometers).
This is a video of a lecture delivered by Prof. Gabriel Popescu (University of Illinois at Urbana-Champaign), co-founder of Phi Optics, the manufacturer of the QPI systems referenced below. Prof Popescu explains the need for QPI and describes how commercially offered solutions combine interferometry and holographic techniques.
This is shown in the sketch below, which is conceptually that of a Michelson interferometer: known phase differences (0, π/2, π, 3π/2) are introduced in an interferometer between reference (un-scattered) and sample (scattered by the phase object) beams. The resulting interferograms/holograms (intensity images) are used to extract a quantitative map of specimen phase shifts with intrinsic contrast (without the need for tagging or staining).

Implementation
As described by Prof. Popescu in the above video, temporal phase sensitivity, governed by the phase stability of the instrument, is the most challenging feature to achieve in QPI. He mentions that it is an age-old challenge, known by Michelson and Morley as early as 1887! Temporal phase noise is due to the path length difference between the reference and object beams. As a case in point, Prof. Popescu refers to the need to build the Laser Interferometer Gravitational-Wave Observatory [LIGO] interferometer with an optical path length sensitivity of less than 10–9 nm, to enable the first experimental observation of gravitational waves.
Most labs lack LIGO-levels of funding (!) but fortunately intrinsically-stable common-path interferometer platforms exist in almost every laboratory in the form of Phase Contrast and DIC configured microscopes in which the two beams effectively travel on top of one another, and as close as possible to one another, thus sharing a common path.
How It Works — Common-Path Interferometry
At the heart of these commercially available QPI techniques lies the interference between two fields:
- Sample beam: light scattered or delayed by structures within the specimen.
- Reference beam: unscattered background light that has experienced nearly the same optical path.
In a common-path geometry, both beams traverse the same optical elements of the microscope, ensuring very good phase stability. This is because the two interferometer “arms” are subject to the same vibration, noise, atmospheric changes, etc. The two paths may be noisy, but since they are subject to the same conditions, the difference between the two phases is very stable. Thus the system has a built-in immunity to vibration or drift. The resulting interference pattern encodes the phase delay Φ(x,y) as intensity modulations I(x,y) = I₀ + I₁ cos Φ(x,y). By recording several intensity frames with known phase shifts (0, π/2, π, 3π/2), the true phase can be numerically recovered.
SLIM – Spatial Light Interference Microscopy

As shown in the previous article, the objective in a Phase Contrast Microscope includes a ring-shaped filter that is placed in the back-focal plane of the objective. The location of the ring-filter maps to the incident unscattered light (as created by the condenser annulus) in the back-focal plane of the objective. Thus, the incident unscattered light is phase shifted by π/2. Prof. Popescu explains how this phase-shifting ring-filter is Zernike’s key contribution in the invention of Phase Contrast Microscopy: it has the effect of “turning a cosine function into a sine function”, making the intensity roughly linearly proportional to the phase. This is what produces a high-contrast image in a conventional Phase Contrast Microscope. However, as noted earlier, the images from a Phase Contrast Microscope are qualitative: phase information cannot be derived from it. As explained in the video, a Phase Contrast image represents one equation with several unknowns (e.g. the two intensities and phase difference).
The SLIM module is added to the camera port of a microscope that is set up for conventional phase contrast microscopy. It effectively allows the generation of four images (by phase-shifting the incident light by 0, π/2, π, 3π/2). This is done by projecting the plane of the Zernike phase-ring onto a Liquid Crystal Spatial Light Modulator (SLM). The “0” position corresponds to the SLM elements acting as a simple mirror, in which case the image obtained is that of the conventional Phase Contrast Microscope. Three additional phase shifts are performed, with the resulting four intensity images providing enough equations to quantitatively estimate the phase difference.
It is worth noting that since SLIM operates with incoherent white-light illumination, it results in speckle-free backgrounds as compared with other methods that use coherent light illumination. Note also that SLIM can be added to an existing microscope that is setup for live-cell imaging including with accessories that include scanning stages, perfusion chambers, etc.

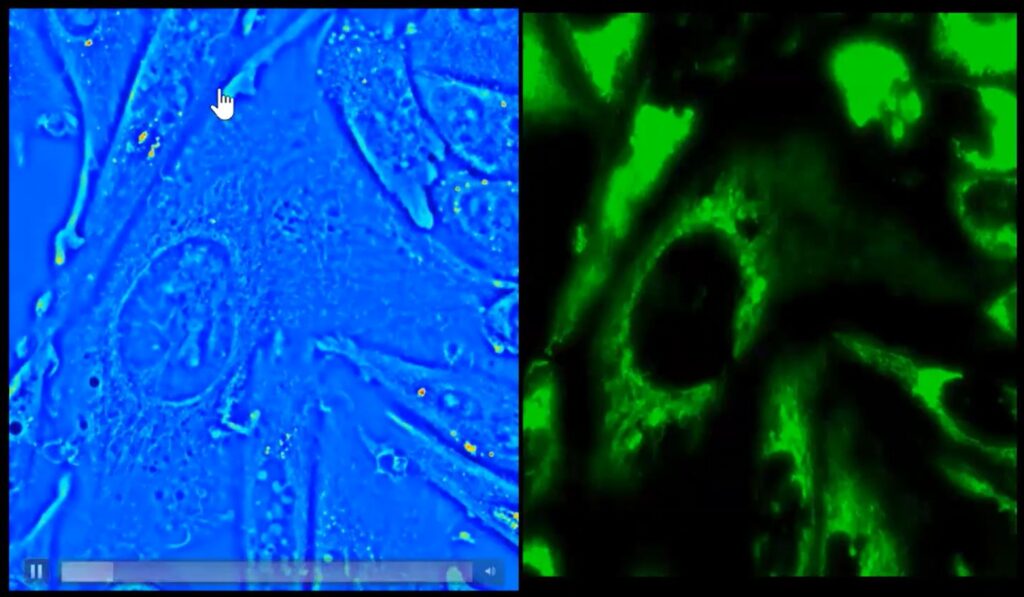
Also, because the optical paths can overlap, one may use SLIM in addition to fluorescence – switching freely between the two modalities thus deriving additional insights from live-cells. The following image shows a side-by-side imaging of CHO-K1 Cells in fluorescence and SLIM
In the above video, Prof. Popescu also showcases other applications of SLIM:
- Fluorescence: as shown above, one may use QPI on microscope that also support fluorescence. In the video, Prof. Popescu mentions that it may be possible to use fluorescence to develop ground-truth data to train AI models that may be able to predict biologically significant characteristics of live-cells.
- Single unlabeled microtubules (24nm)
- Converting phase information into dry mass (in picograms), estimating cell growth in E. Coli
- Neuroscience: using phase maps as density maps to show the development of neuronal networks as they grow
- Tomography: leveraging SLIM’s high Numerical Aperture (NA) and White light Power Spectrum to develop the 3D structure of live cells from refractive index data

Limitations of SLIM: While SLIM works well for thin objects it is not well suited for QPI in thicker scattering samples. This is because it takes both interfering beams to have equal power to obtain high contrast images. When used with thicker samples, the scattering media decreases the incident light, while the light from the sample is relatively bright. The interference between the low intensity incident light and the relatively bright light from the sample results in low contrast images. This brings us to another QPI technique – GLIM (Gradient Light Imaging Microscopy) which can be used with thicker scattering samples.
GLIM – Gradient Light Imaging Microscopy
As Prof. Popescu explains in the video [at the 34:00 mark], Gradient Light Interference Microscopy (GLIM) does to a Differential Interference Contrast (DIC) microscope exactly what SLIM does to a Phase Contrast microscope! It uses the Nomarski or Wollaston prism inside the DIC optical path as a built-in interferometer.
Operating principle
As explained in the previous article, in DIC microscopy, the prism splits illumination into two orthogonally polarized beams separated by a small lateral shear. After passing through the specimen, each beam acquires a different phase, but their intensities are equally affected by the scattering media. The 2nd prism and analyzer recombines the beams, converting their phase difference into intensity variation by interference. The intensity variation corresponds to the gradient of optical path length rather than its absolute value, approximating the derivative of the phase (which is integrated during phase reconstruction). Since the interference images correspond to the gradient of the OPL, the technique is referred to as Gradient Light Imaging Microscopy.
As described above in the context of SLIM, GLIM also introduces a controlled phase delay [(0, π/2, π, 3π/2] between these sheared beams using a liquid-crystal or electro-optic retarder. But since both beams are equally affected by the scattering media, their intensities are the same and their interference results in high contrast images.
The following image shows a thick sample (bovine embryos) under both SLIM and GLIM, to showcase the advantage of using GLIM for thick, scattering samples.


