QE Curves for sCMOS and CMOS imagers
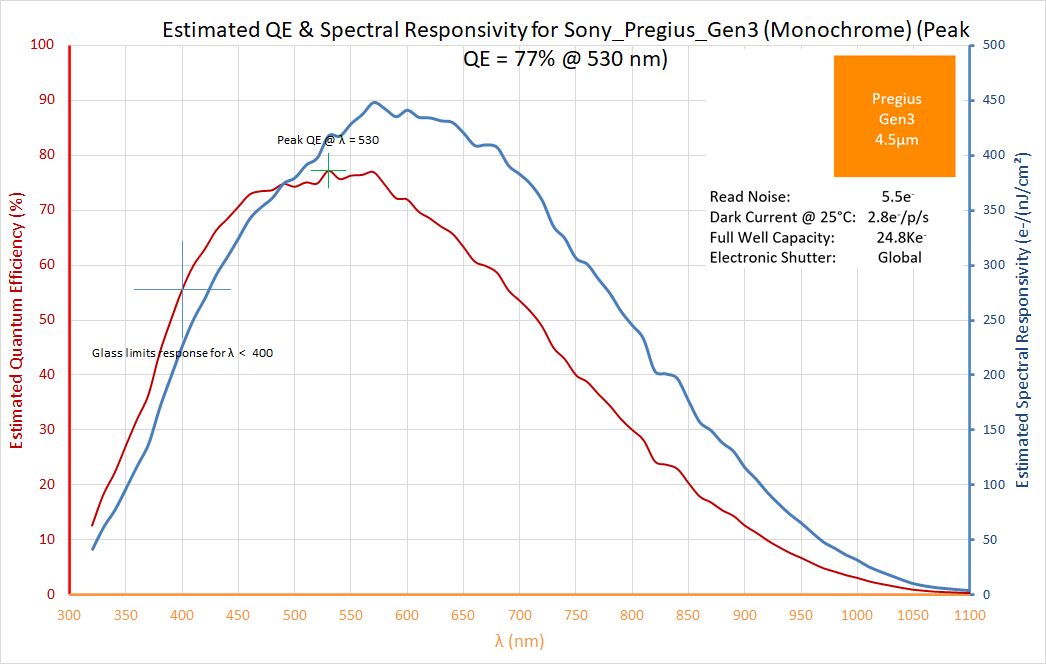
The quantum efficiency (QE) of an imager is defined as the number of electron-hole pairs created and successfully read out for each incoming photon. It is a function of the material used (e.g. silicon) as well as any structures that exist in the optical path of the pixel, for example, faceplates, micro-lenses, gate structures, etc. It is typically expressed as a percentage, representing the probability of that a photon of a particular wavelength will be detected. If 77 of every 100 incident photons of λ = 530nm are likely to be detected, then the QE at 530nm is estimated to be 77%.
A QE curve is a graph of the Quantum Efficiency vs. wavelength.
The following is an interactive plot of the QE curves for cameras based on sCMOS and CMOS imagers. They are shown on one rather crowded graph for comparison. The following interactive features of this graph can be helpful:
- Click in the legend area to turn on or off the plots for selected imagers.
- Use your mouse to read QE data for all displayed imagers at the wavelengths of interest.
- Right-click and drag to zoom in along the X-axis to expand the view for a desired range of wavelength.
- To pan left or right within a zoomed-in view, hold down the Shift key and use your mouse.
- To revert from the zoomed-in view to the normal view, click on the “Reset zoom” button that is displayed at the top-RHS of the graph.
Spectral Responsivity
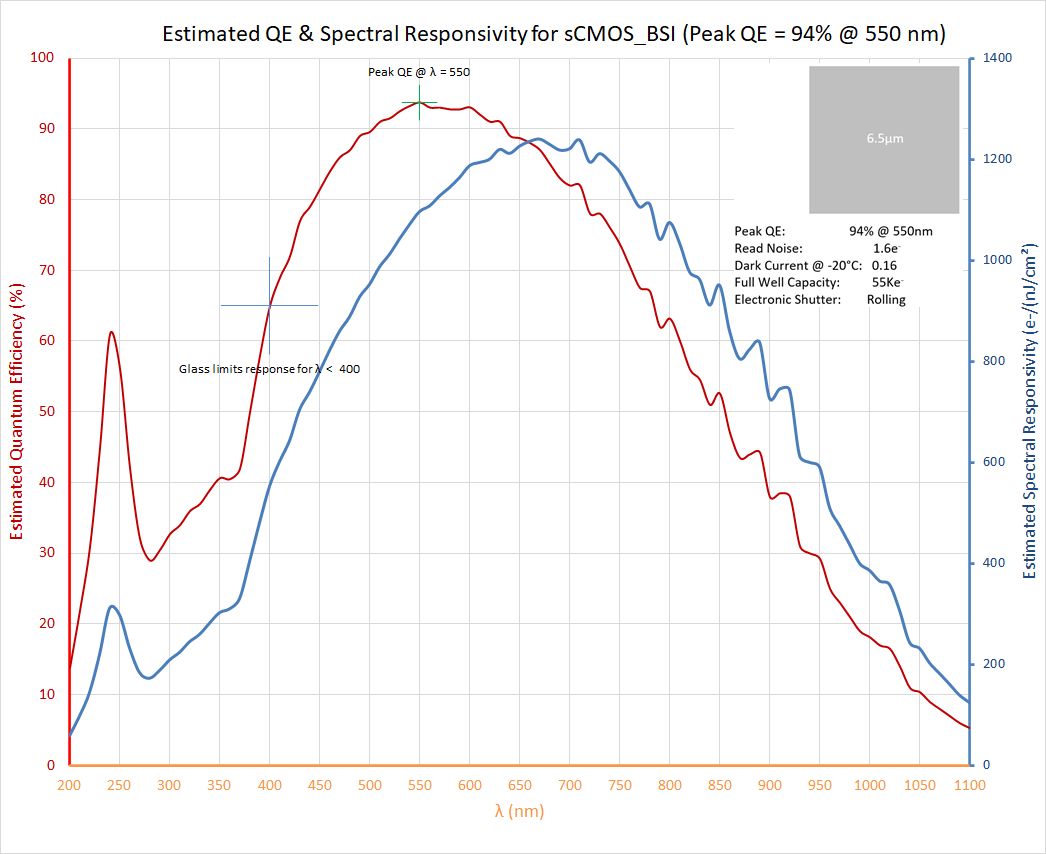
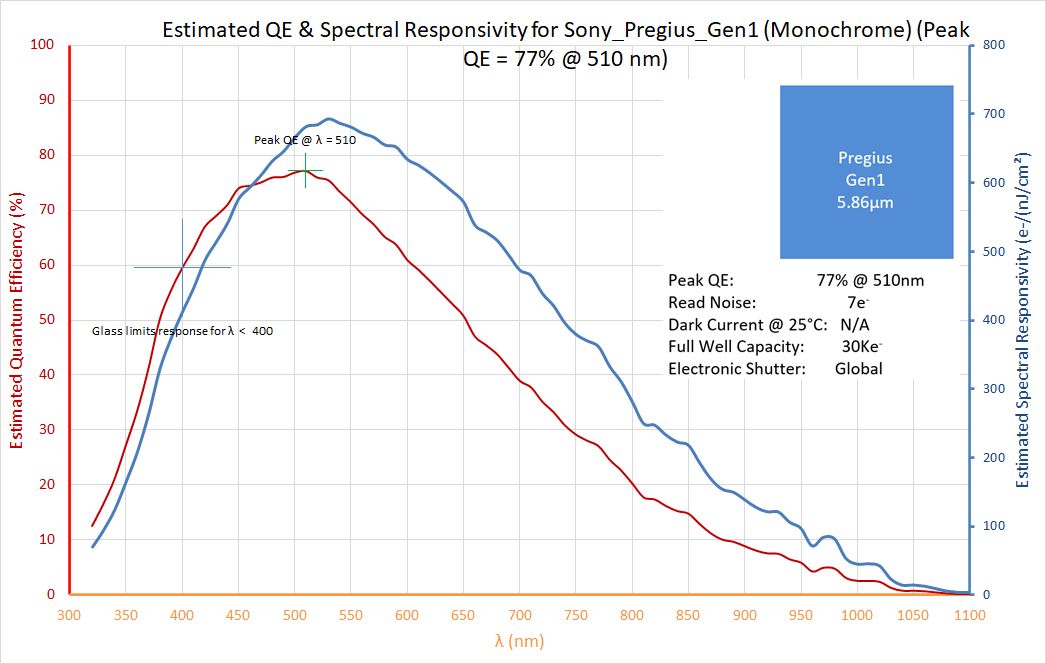
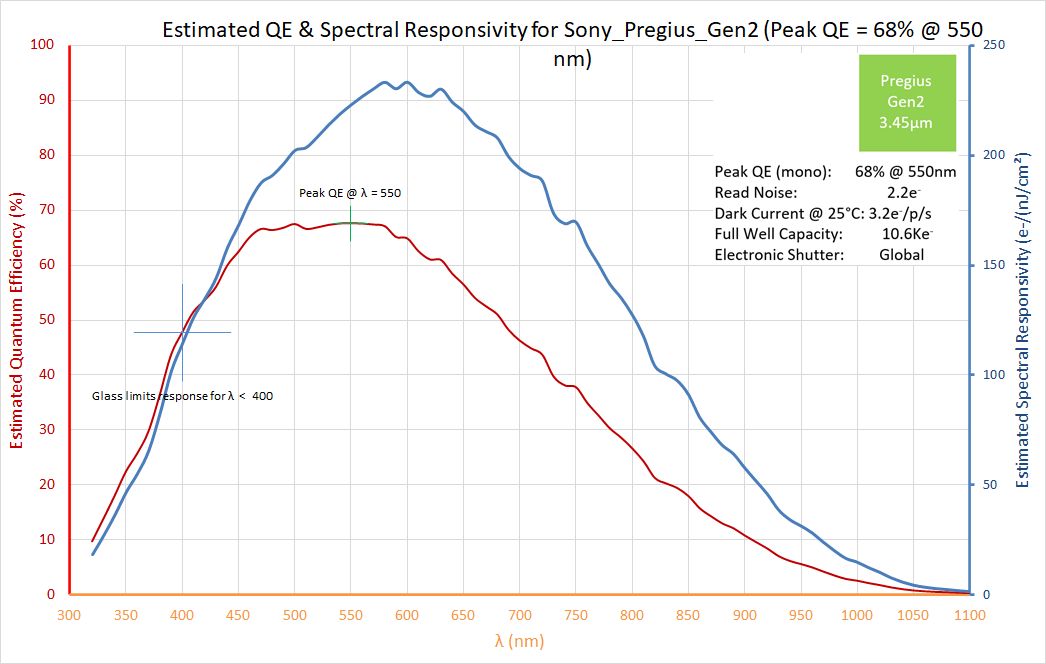
Spectral responsivity is an estimate of the number of photoelectrons that are generated by a unit of radiant energy (1 nJ/cm2). It conveys similar information as the Quantum Efficiency, but allows us to conceptualize the conversion of light to photoelectrons in radiometric units. This can be useful in, for example, estimating the response of a camera to laser illumination at different energy levels and/or wavelength.
Please check out our Knowledge Base article on the Method of Estimating Spectral Responsivity from Quantum Efficiency curves.
Click on the link for more information about cameras with sCMOS imagers.
Click on the link for more information about cameras with CMOS imagers.
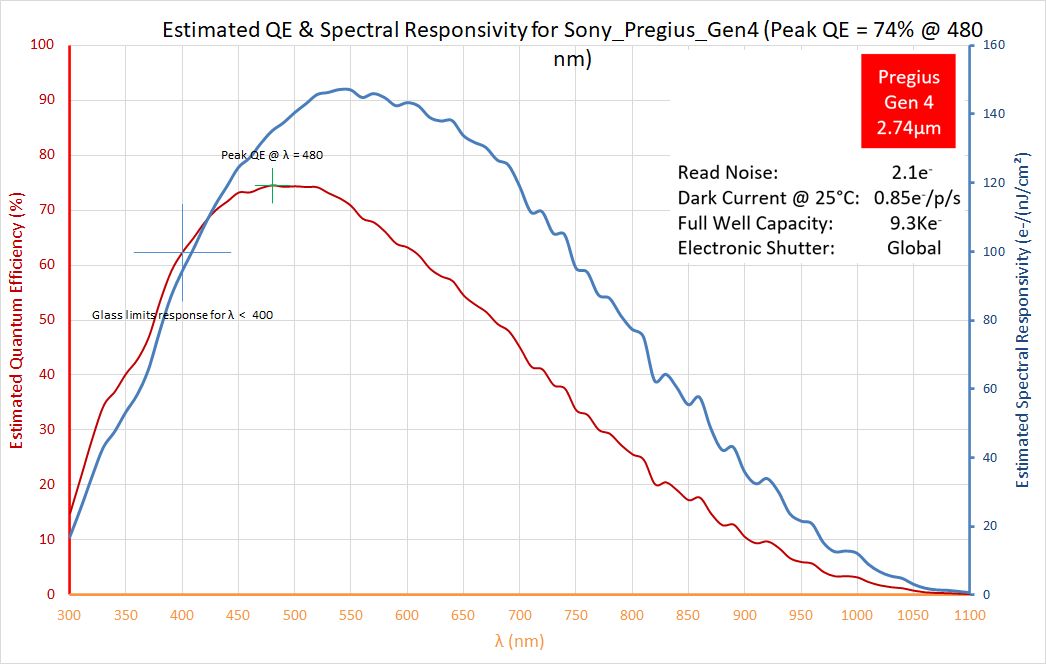
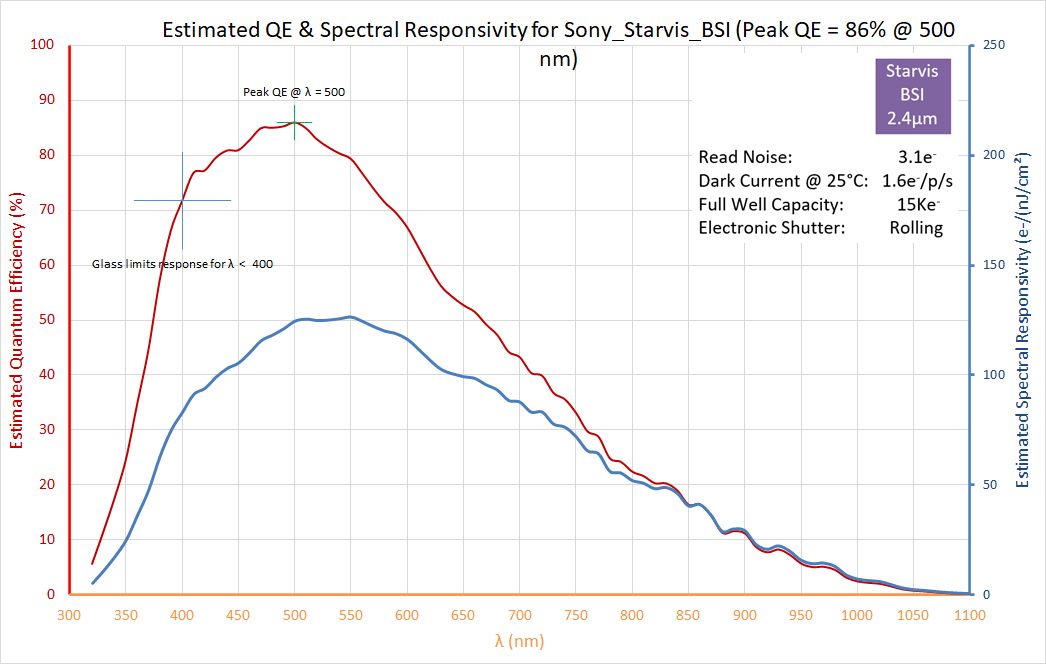
Quantum Efficiency and Spectral Responsivity graphs
The graphs provided in this section are an estimate of the spectral response of the imager, based on information that is available from various sources. This data is not provided by the imager manufacturer, nor was it obtained by measurement in the cameras referenced on this site. It is provided for reference purposes only and should not be used as a guarantee of performance.
Note that the secondary y-axes that represent the Estimated Spectral Responsivity on the following graphs are scaled differently.

