Quantum Efficiency Curves
A QE curve is a graph of the Quantum Efficiency vs. wavelength.
An estimated QE curve for a monochrome Sony Pregius Gen3 imager is shown above. Note that although the imager shows response at wavelengths below 400nm, glass and other materials in the optical path typically cut off below ~400 nm. Therefore responsivity below 400nm is unpredictable.
Some monochrome cameras have NIR-blocking filters installed. For such cameras responsivity above ~700 nm will be cut off. This is done to ensure that their overall spectral response is a closer approximation of the photopic response of the human eye. NIR-blocking filters must be removed if a camera is to be used in experiments involving NIR imaging above 700nm.
An estimated QE curve for the RGB Color version of a Sony Pregius Gen3 imager is shown above. For a specific imager the R, G and B version may be thought of as having the same pixels as that of its monochrome counterpart with Red, Green or Blue filter dots applied to each pixel in a repeating pattern such as the Bayer filter pattern.
For this reason, the responsivity of color pixels is less than that of the underlying monochrome pixel at a particular wavelength. Most color cameras have NIR-blocking filters installed because the R, G and B filter dots may be transmissive at the higher wavelengths. Removing the NIR-blocking filter in a color camera will lead to images that are not photo-realistic.
Due to the likelihood of variation in materials and processes involved in manufacturing an image sensor, some manufacturers (e.g. Sony) do not publish the QE curves of their products in terms of absolute percentages as described above. Instead, they publish a “relative response” graph that is normalized to the peak for a particular device. For the same reason, many camera manufacturers do not publish measured values for QE.
All QE values on this website are the best estimates available from various sources, and not necessarily from the manufacturer of the specific image sensor or from the manufacturer of the cameras in our Product Showcase. As described above, these values exist in a range. Therefore no absolute precision is implied, even when QE values are shown to two decimal places! These values and graphs are intended to be used for reference can be use for making useful comparisons between cameras. They are not intended to be a specification or a performance guarantee.
For interactive plots of the QE curves for cameras based on different types of imagers, please check out our Knowledge Base articles titled QE curves for sCMOS imagers and QE Curves for CMOS imagers.
The following is an interactive plot of the QE curves for cameras based on sCMOS and CMOS imagers. They are shown on one rather crowded graph for comparison. The following interactive features of this graph can be helpful:
- Click in the legend area to turn on or off the plots for selected imagers.
- Use your mouse to read QE data for all displayed imagers at the wavelengths of interest.
- Right-click and drag to zoom in along the X-axis to expand the view for a desired range of wavelength.
- To pan left or right within a zoomed-in view, hold down the Shift key and use your mouse.
- To revert from the zoomed-in view to the normal view, click on the “Reset zoom” button that is displayed at the top-RHS of the graph.
Spectral Responsivity
Spectral responsivity is an estimate of the number of photoelectrons that are generated by a unit of radiant energy (1 nJ/cm2). It conveys similar information as the Quantum Efficiency, but allows us to conceptualize the conversion of light to photoelectrons in radiometric units. This can be useful in, for example, estimating the response of a camera to laser illumination at different energy levels and/or wavelength.
QE and Spectral Responsivity are similar concepts, but they are different
Both QE and Spectral Reponsivity are ways in which we can grasp the Photoelectric Effect concept in quantitative terms. However, they are different due to the properties of light.
When thinking in terms of QE, we consider photons as the input and photoelectrons as the output of an image sensor. In this context, a “red” photon as no different from, let’s say, a “green” photon. We are concerned only with the probability that photons of different wavelengths are converted into photoelectrons. This probability is represented as a percentage, which we specify as the QE at that particular wavelength.
When thinking in radiometric terms however, we consider luminous energy to be the input, and electrons (or amperes, or even camera values output as Analog-to-Digital Units) as the output. It is now significant to note that the energy that is associated with a “red” photon is different from the energy associated with a “green” photon.
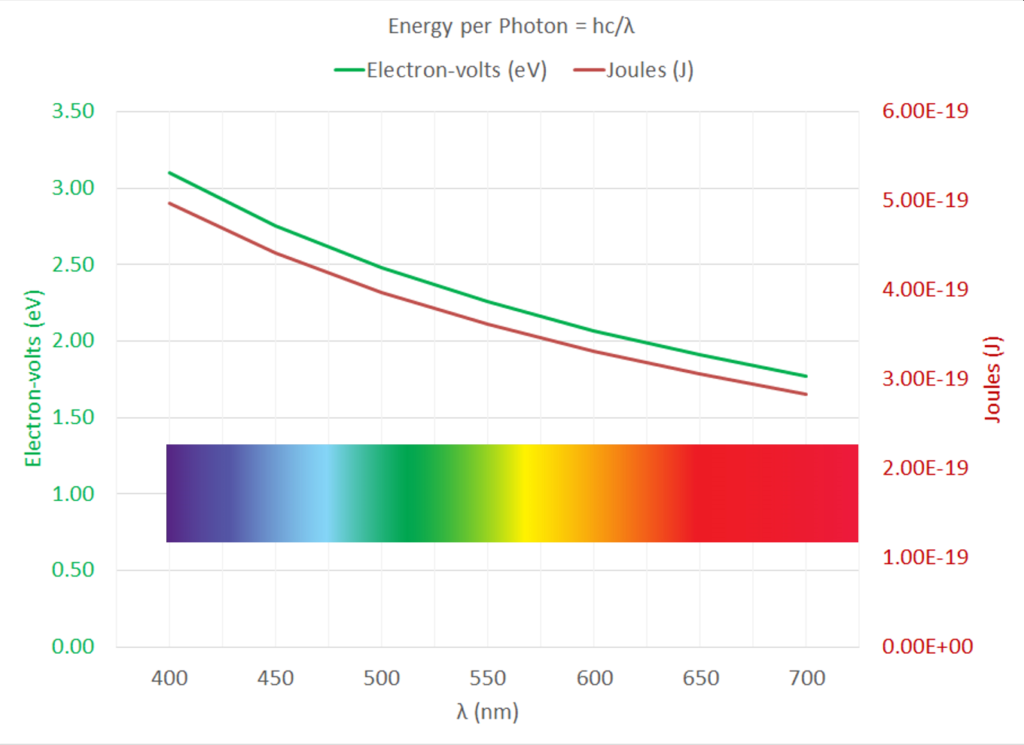
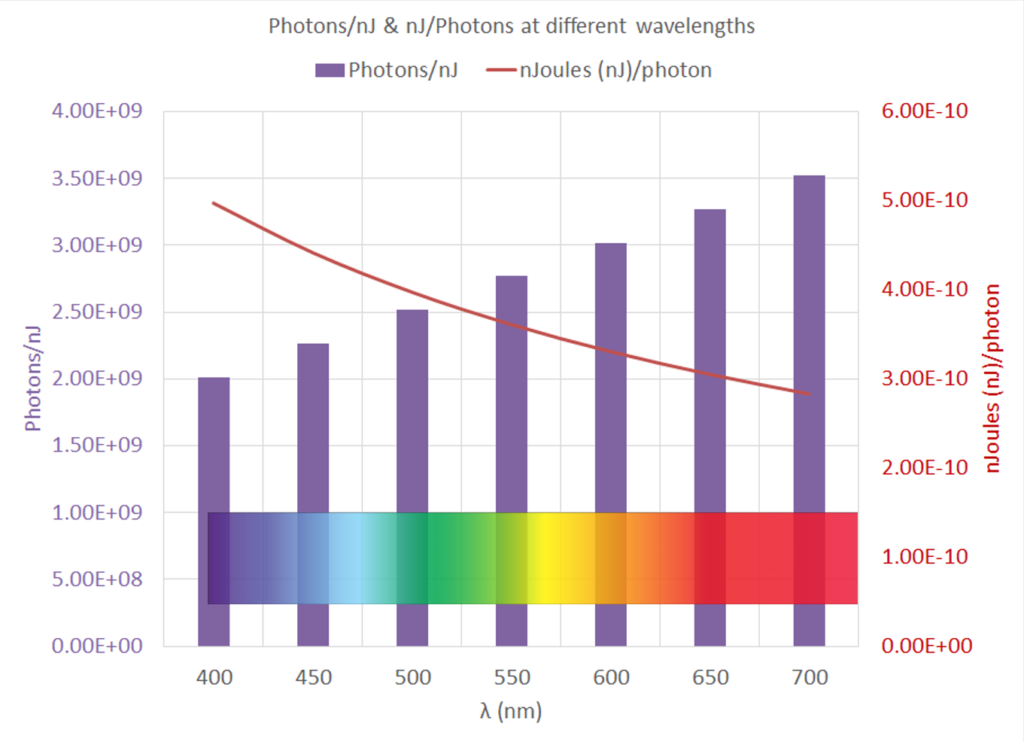
As further detailed in the article titled Estimating Spectral Reponsivity from QE, we recognize that the energy associated with a photon is inversely proportional to its wavelength: this is the inverse relationship governed by Planck’s equation: E = hc/λ, with h = 6.625 × 10⁻³⁴ Js and c is the velocity of light, which results in values of 4.97 × 10⁻¹⁰ nJ (400 nm) to 2.84 × 10⁻¹⁰ nJ (700 nm) for the visible part of the electromagnetic spectrum. We can convert from nJ to Electron-volts, using the fact that 1Electron-volt = 1.602 × 10⁻¹⁰nJ.

| λ (nm) | hc/λ (nJoules per photon) | hc/λ (Electron-volts per photon) | Photons/nJ |
| 400 | 4.97E-10 | 3.1 | 2.01E+09 |
| 450 | 4.42E-10 | 2.76 | 2.26E+09 |
| 500 | 3.98E-10 | 2.48 | 2.52E+09 |
| 550 | 3.61E-10 | 2.26 | 2.77E+09 |
| 600 | 3.31E-10 | 2.07 | 3.02E+09 |
| 650 | 3.06E-10 | 1.91 | 3.27E+09 |
| 700 | 2.84E-10 | 1.77 | 3.52E+09 |
The number of photons that correspond to a nJ of energy is simply the reciprocal of the number of nJ/photon.

The takeaway from the above analysis is that a different number of photons are required to make up 1nJ of energy at different wavelengths: ranging from 2.01 × 10⁹ photons at 400 nm to 3.52 × 10⁹ photons at 700 nm. Spectral Responsivity is based on luminous energy as the input to the image sensor; this is different from Quantum Efficiency which is based on the number of photons as the input to the image sensor. When we use the concept of Spectral Responsivity instead of Quantum Efficiency, we are taking into account the fact that a unit of energy requires more photons at, for example, 700nm than at 400nm.
This also points in the direction of a method to estimate Spectral Responsivity of a detector for a given wavelength, if its QE is known – and vice versa. This is described in our next Knowledge Base article titled Estimating Spectral Responsivity from QE,

