Photons are a source of noise
It is a common notion that the camera receives “pure” signal from the sample in the form of photons, and that noise is just something that the camera adds, corrupting the signal. In reality, the photons from an experimental sample do not just convey a pure “signal” to an imaging system. As described earlier, the arrival statistics of photons, even under conditions of uniform flux follow a Poisson distribution. They are best modeled as a statistical distribution of the number of photons that arrive per second at each pixel.
In the diagram below, the Photon arrival statistics P(x) are shown as a Poisson Distribution, with the mean value (for the sake of this example), shown as 100 Photons/sec. The actual number of Photons that are estimated to arrive in a given second will vary with a probability that is shown normalized w.r.t the mean. This means that even for a “static” image with a mean Photon Flux of 100photons/sec, there may be 96 incident photons in one second, and 102 photons in the next … and so on!
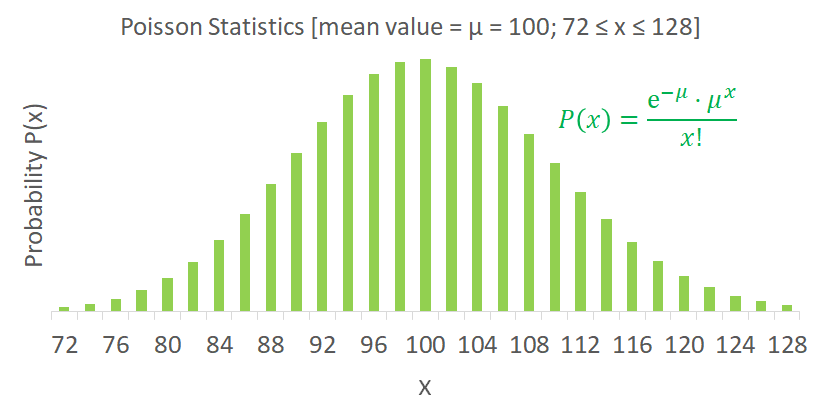
This tells us that there is a temporal variation – noise – that “accompanies” the photons at the input of an imaging system. So, even before our imaging system contributes any noise, we have to be aware of the noise that is present at the input of the system, along with the photons!
Signal and Photon Shot Noise
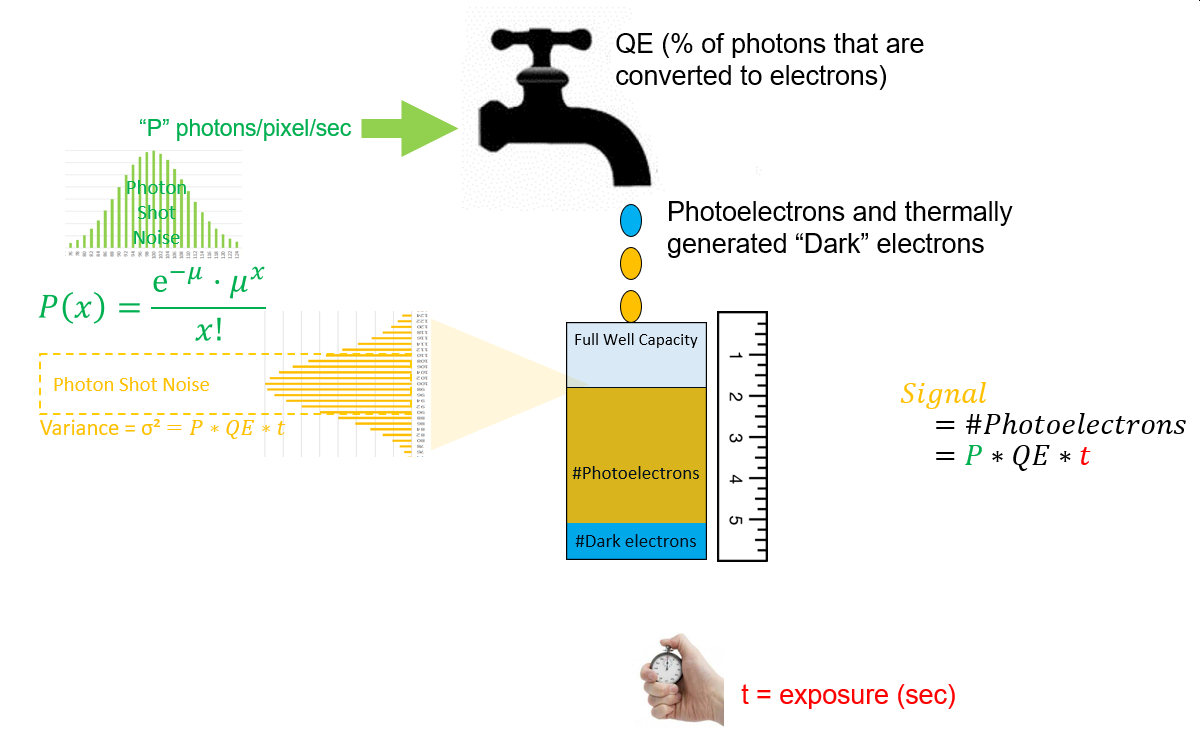
The number of photoelectrons that are accumulated in each pixel is directly proportion to the exposure duration. As shown previously, the equation is:
#photoelectrons (signal) = P*QE*t
Block Diagram: modeling a camera in terms of Signal and Noise
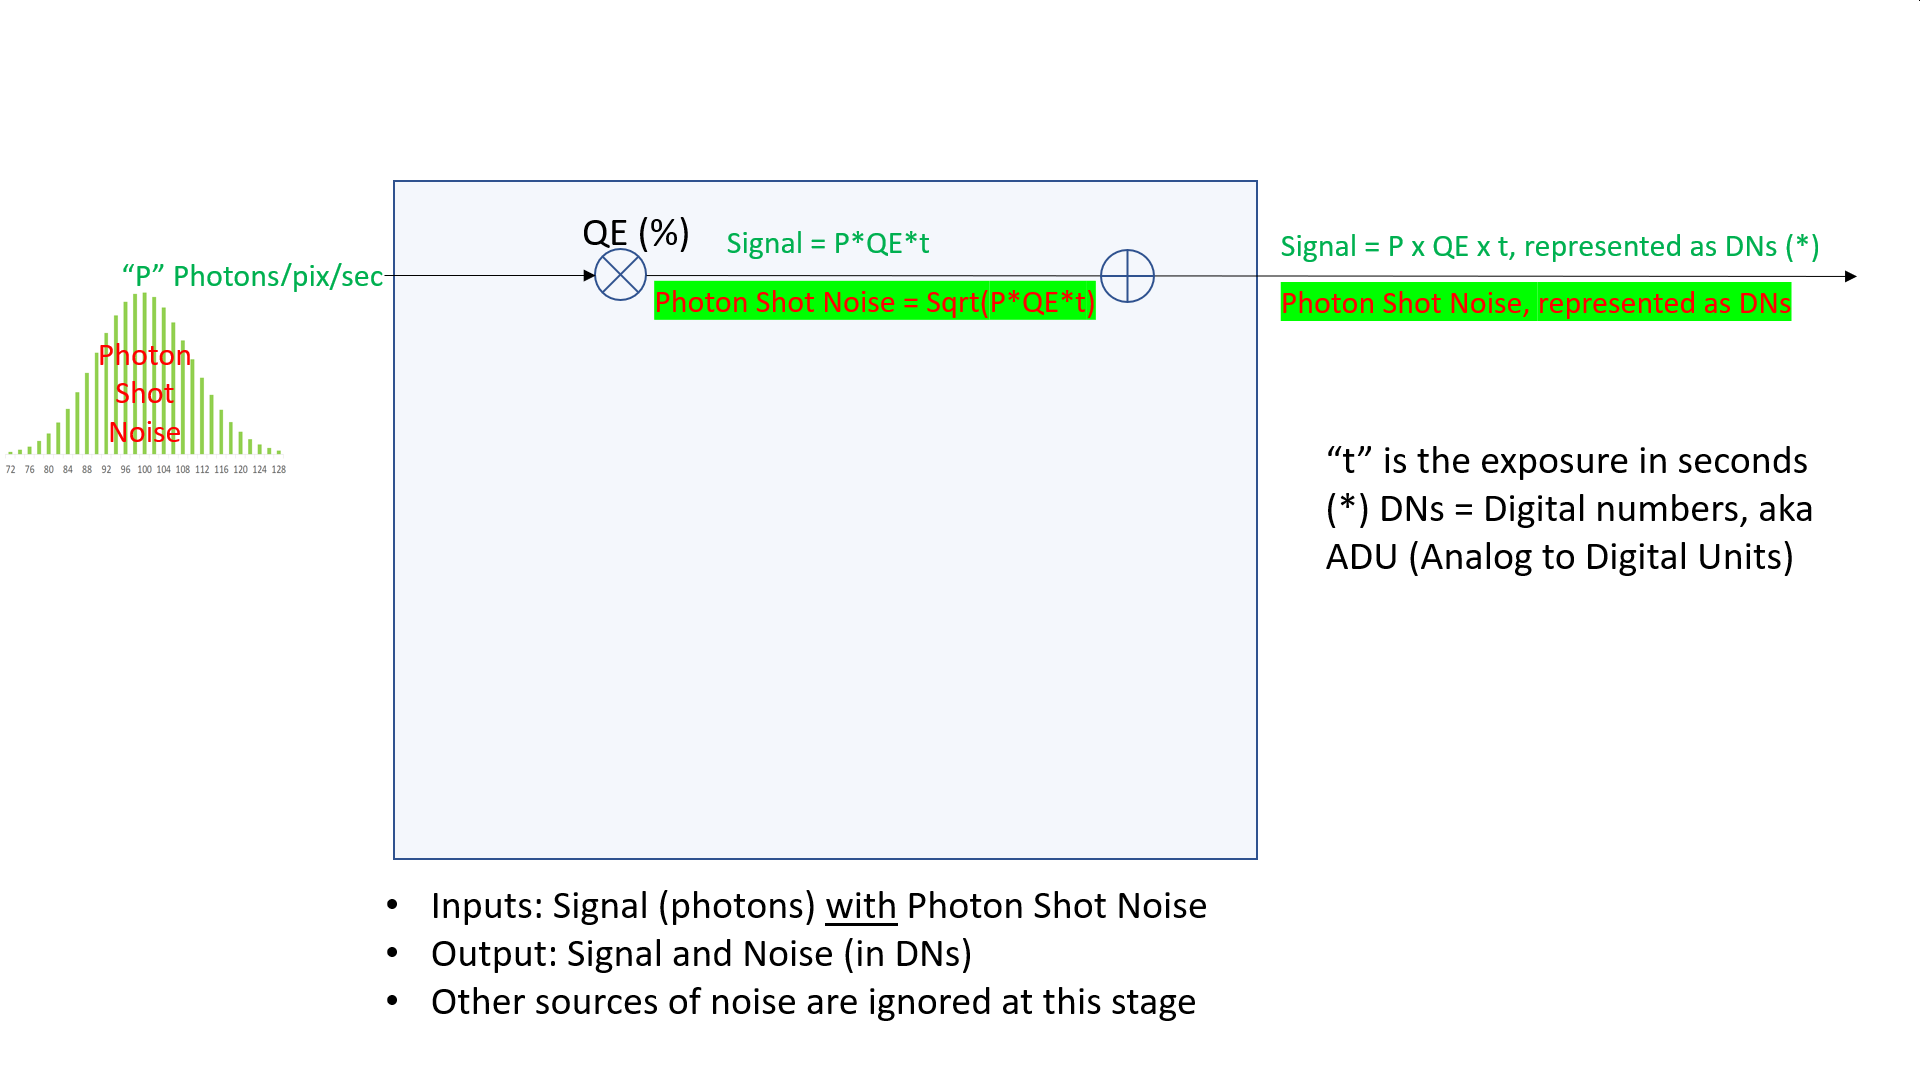
An Ideal Imager
It can be inferred from the above that even an ideal imager (which may be defined as an imager with a QE of 100% and that contributes no noise at all), is not free of noise. It is subject to a signal-dependent temporal uncertainty in its input, which presents as temporal noise in its output. In other words, even an ideal imager has a finite Signal-to-Noise ratio. This effectively sets up a maximum, shot-noise-limited SNR which real-world imagers may approach, but never surpass.
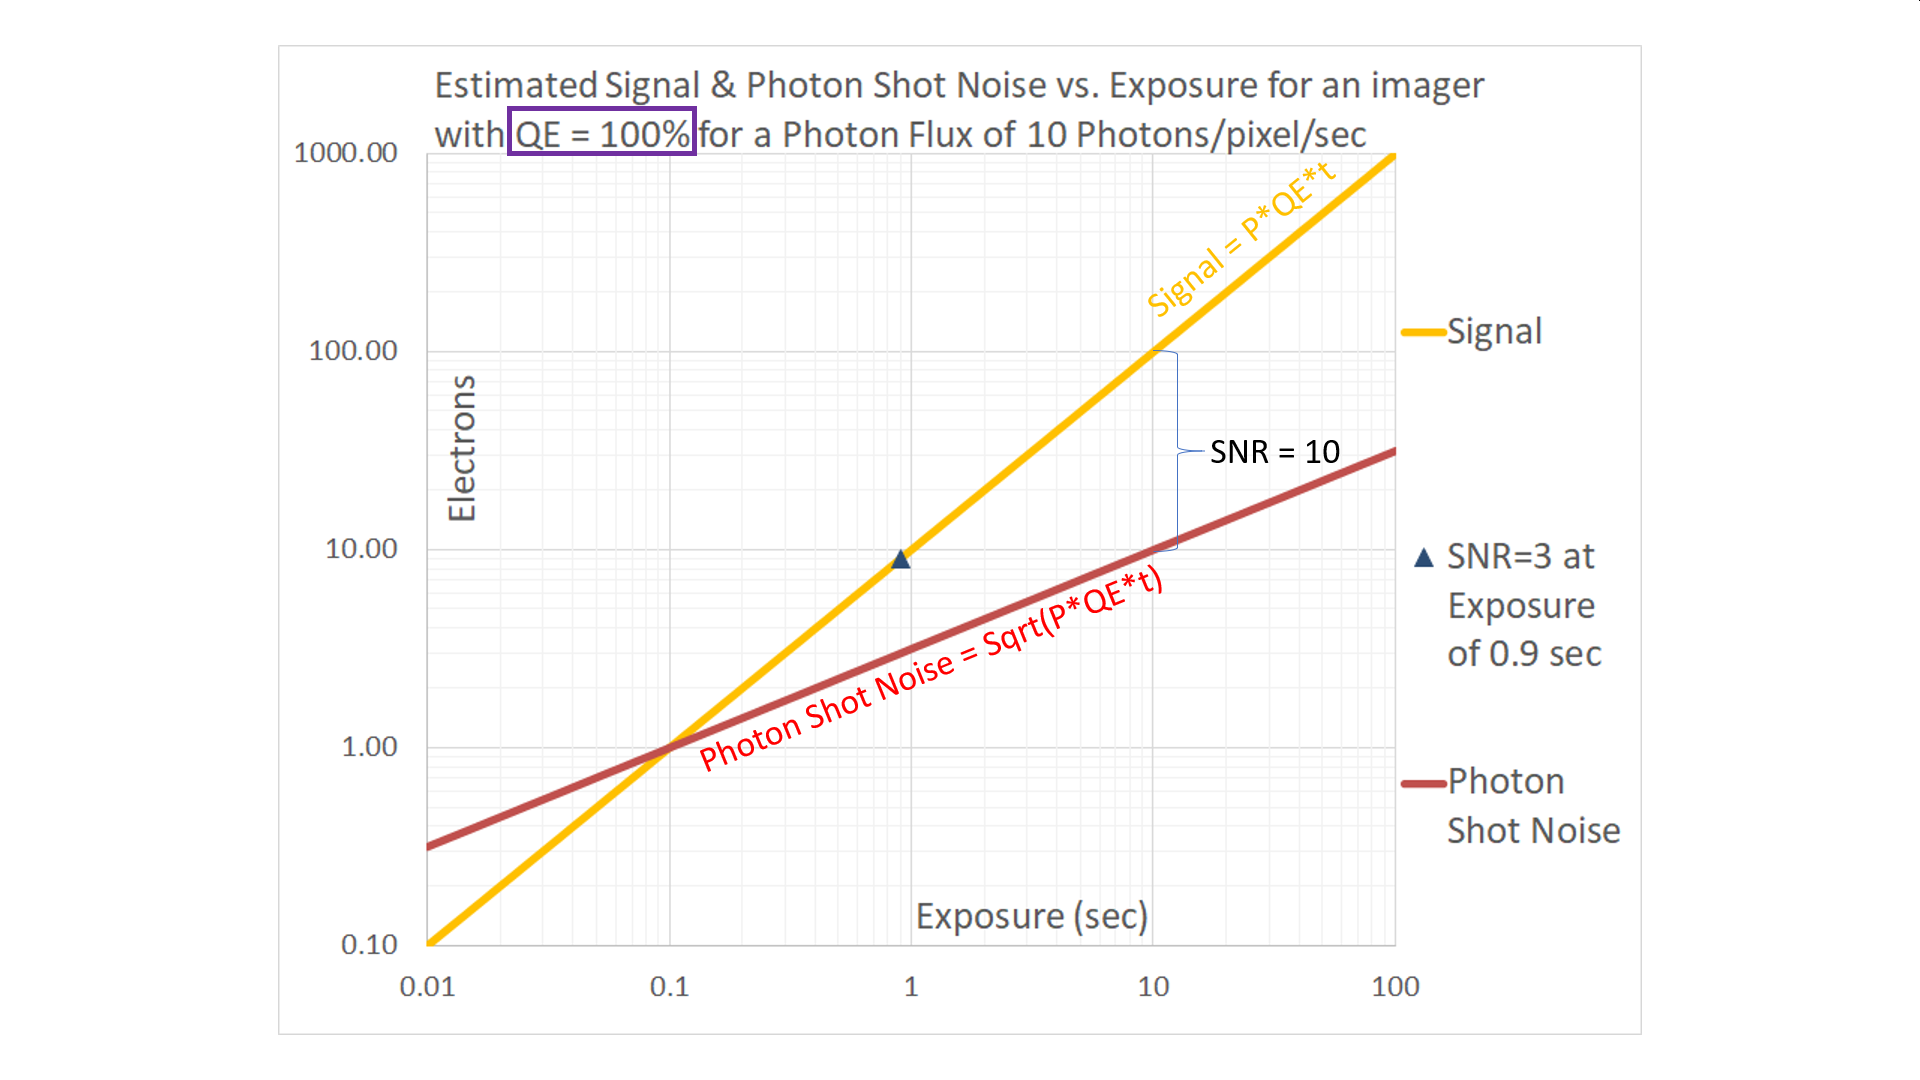
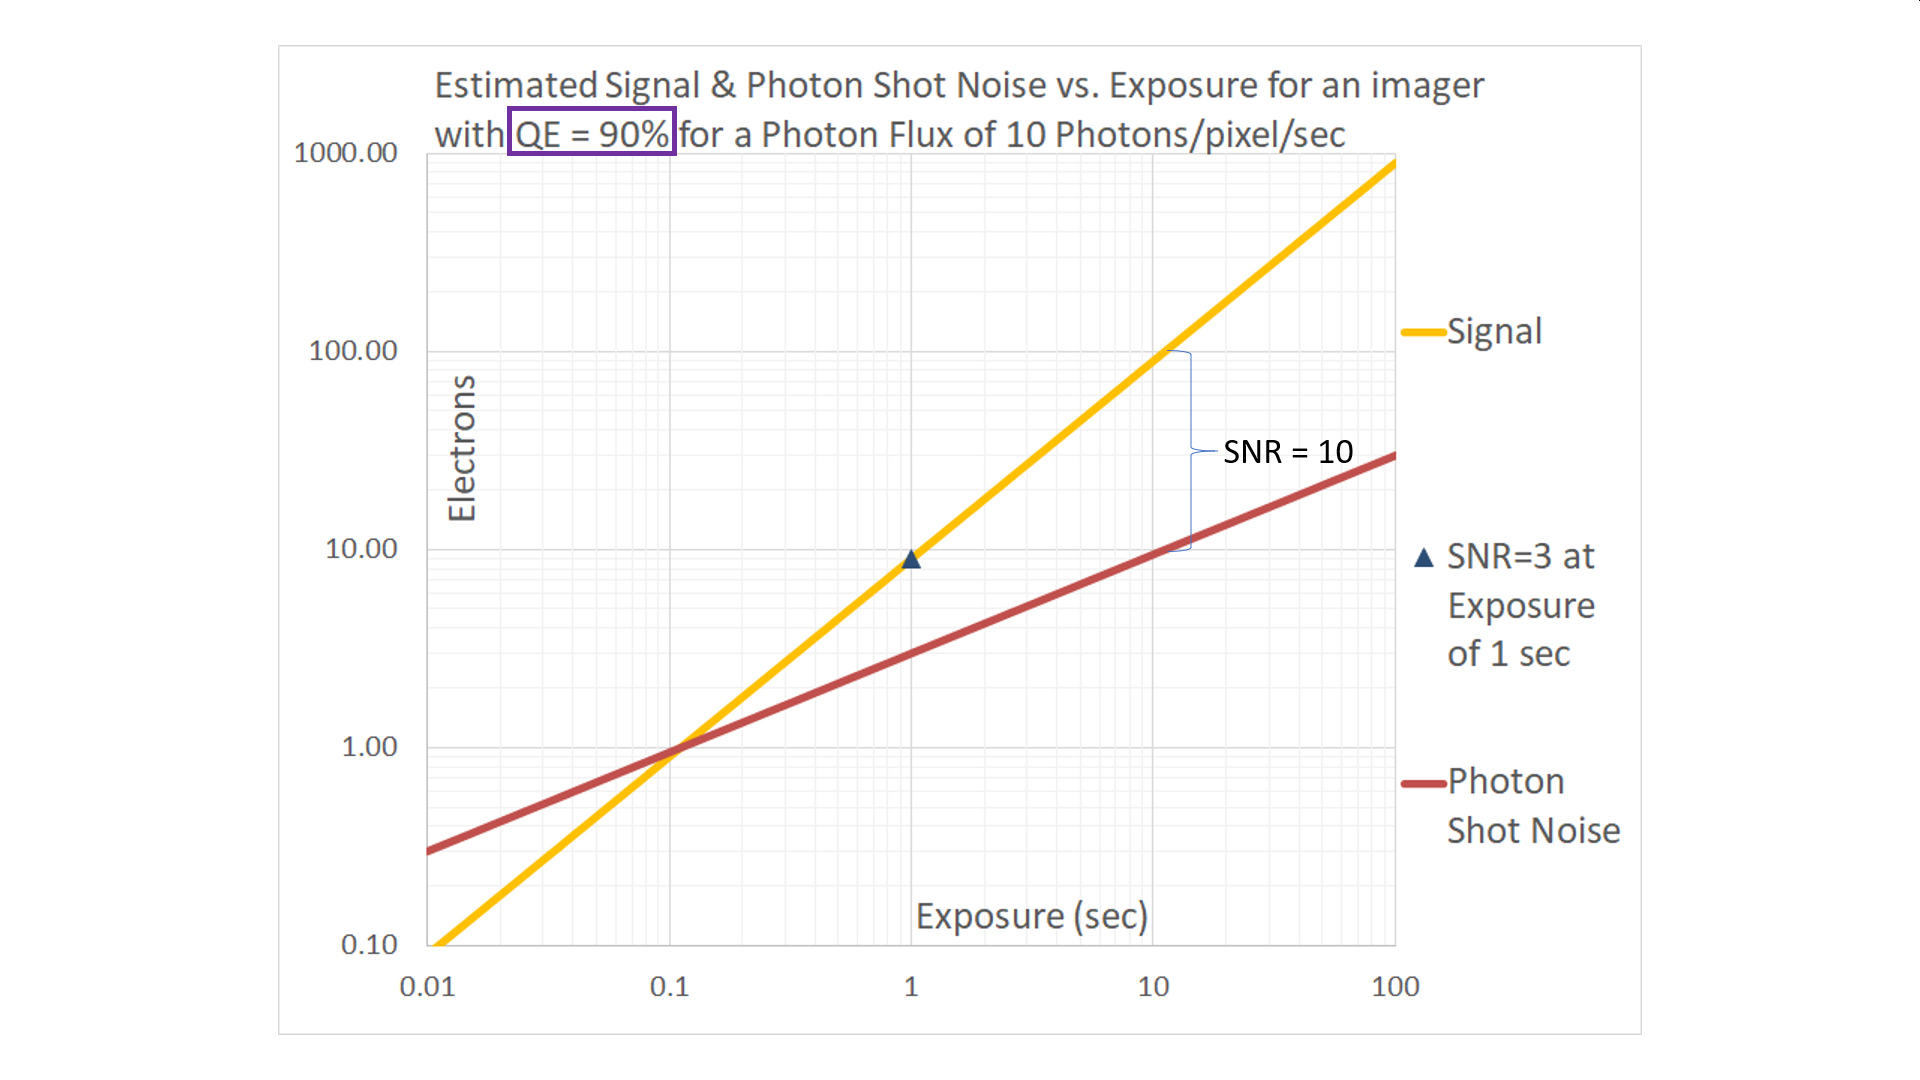
For an ideal imager, QE = 100%. This means that the number of photoelectrons generated is the same as the number of incident photons. The signal, which is shown in the golden-yellow curve below for P = 10 Photons/pixel/sec, is directly proportional to the duration of exposure. On a log-log graph, the signal is represented as a line with a slope of 1; it rises 1 decade for every decade of exposure.
On this graph the red curve represents the Photon Shot Noise. Since photon shot noise follows a Poisson distribution, it is estimated as the square root of the signal. On a log-log graph, this curve is represented as a line with a slope of ½, rising one decade for every two decades of exposure.
The two lines intersect when Signal = Photon Shot Noise, representing an SNR = 1. Since the square root of 1 is 1, the lines for Signal and Photon Shot Noise intersect at 1.0e–.
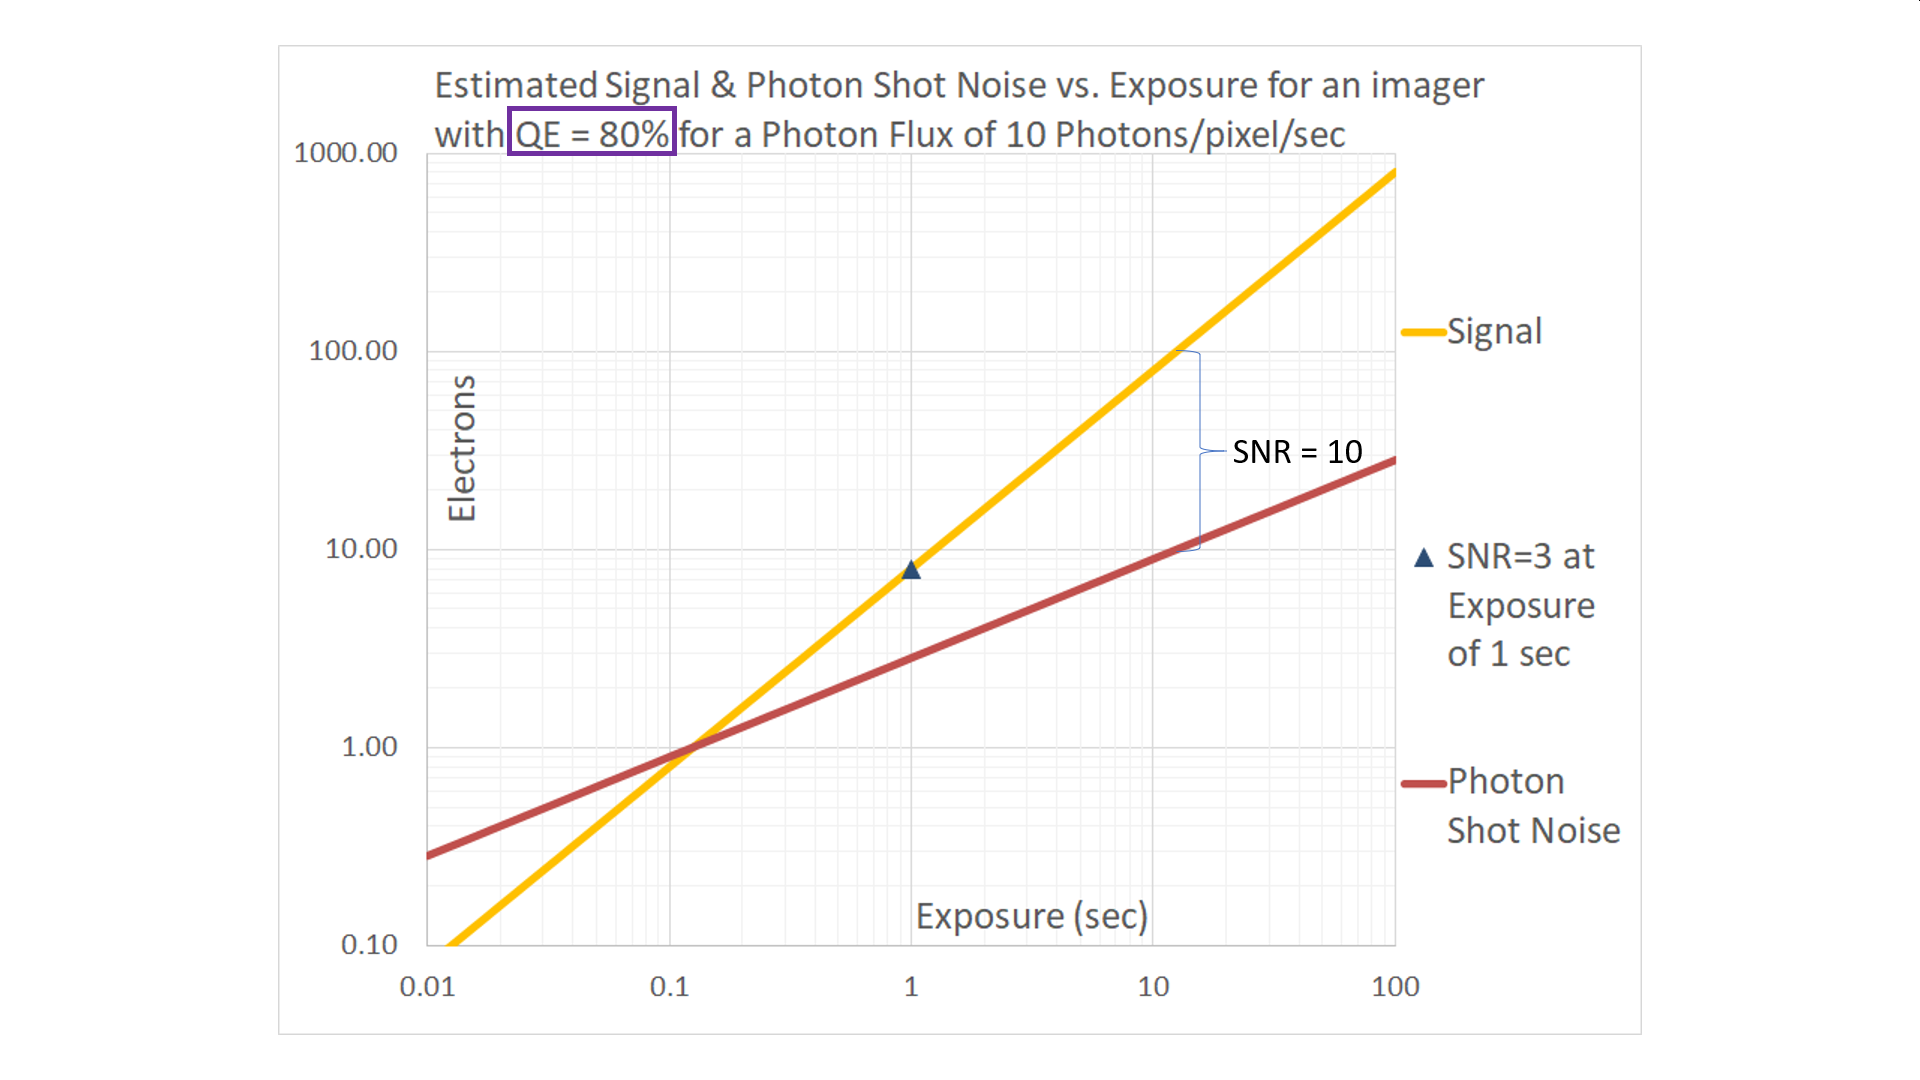
Real-world imagers do not have QEs of 100%. The next graph shows the impact of a relatively small change in QE, from 100% to 90% under the same Photon Flux.
Signal to Noise Ratio in shot-noise-only systems
The Signal-to-Noise ratio in these shot-noise-only systems is the Signal divided by the Noise, which is the Signal/Sqrt(Signal) = Sqrt(Signal) = Sqrt(P*QE*t). When plotting SNR vs. Exposure, on a log-log scale, we obtain a straight line that has a slope of 1/2, rising one decade for every two decades of exposure.
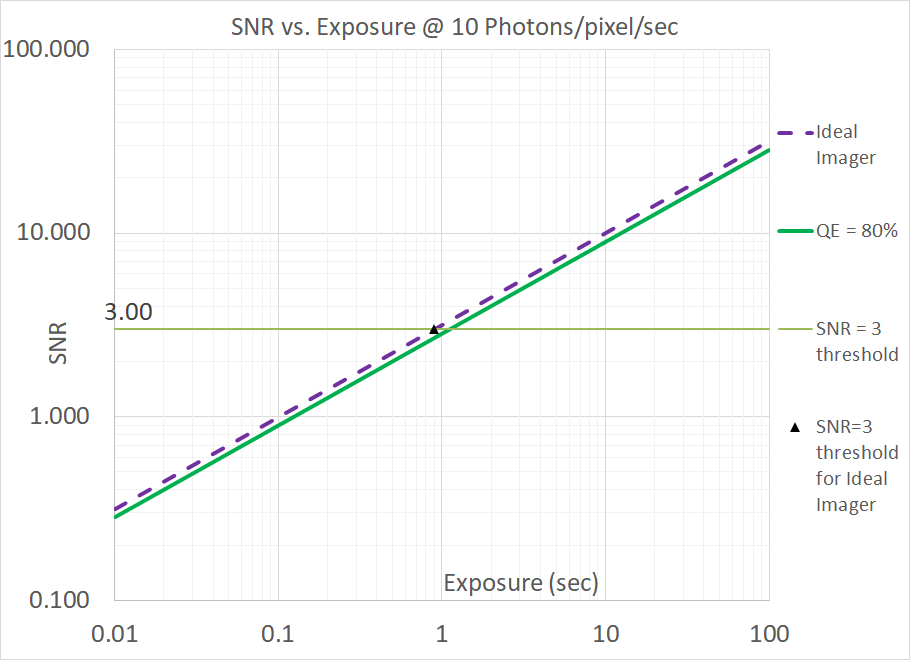
For imagers with lower QE, longer exposures are needed to achieve the same SNR. This was indicated above in the example with the Ideal imager and the imager with a QE=90%. By way of an additional example: in a photon-shot-noise-limited scenario, an imager with a QE of 60% will require an exposure that is 80/60 = 1.33x longer than that of an imager with a QE of 80% to achieve the same SNR (all else being equal).
Photon Flux
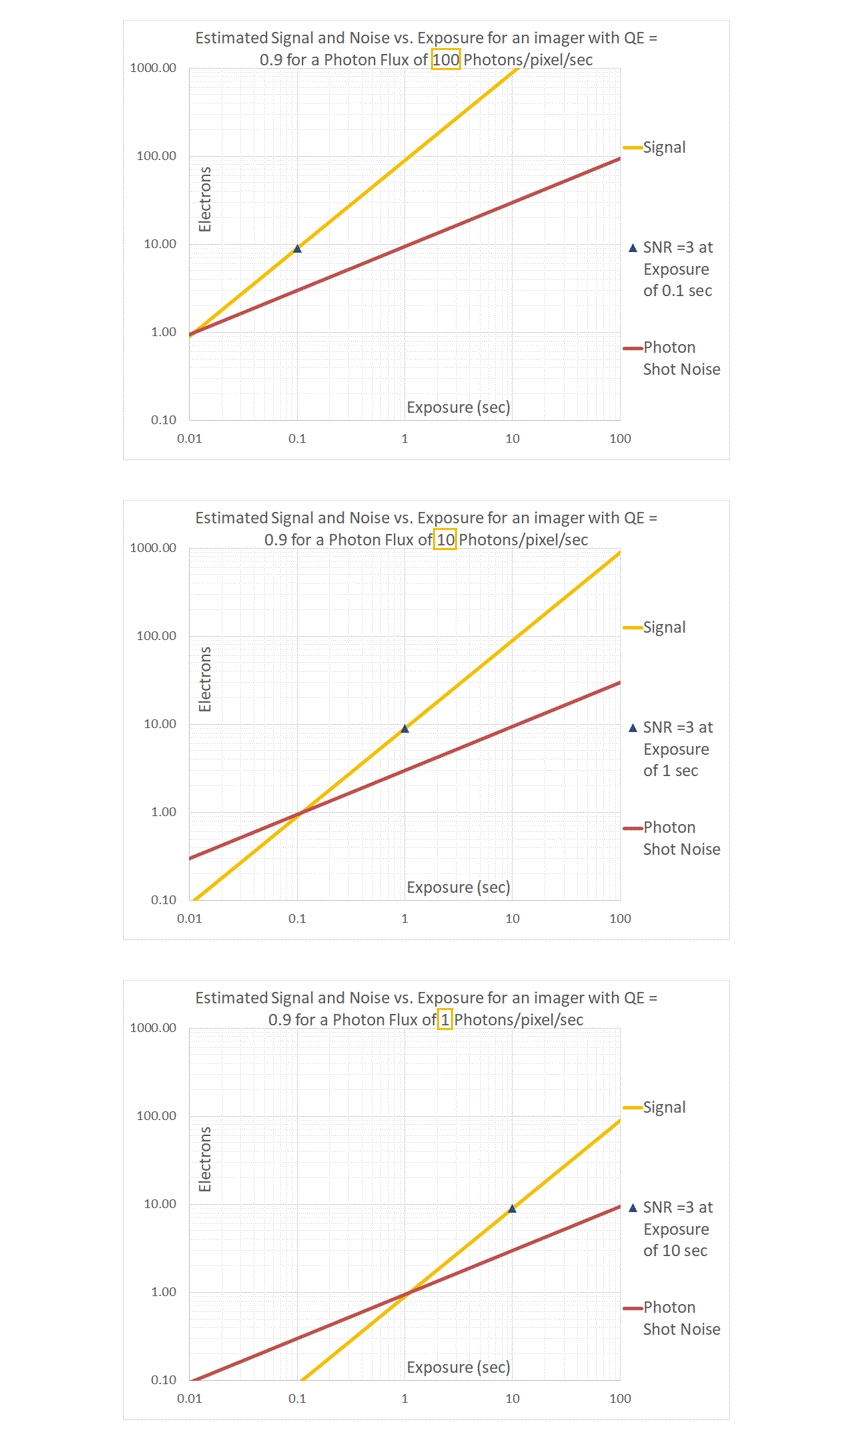
If the photon flux P were to decrease, both the signal and photon-shot-noise curves move downwards and parallel, maintaining their respective slopes of 1 and ½ respectively. If P increases, the curves move upwards, maintaining their slopes and always intersecting at 1.0e–.
Pixel Size
In our analyses, we have been using “P” to designate the number of photons per pixel per second. There is an implicit assumption built into our choice of units that “P” represents the Photon Flux Density (in photons/sq-um/sec) multiplied by the area of a pixel (in sq-um). The statements made above about the Photon Flux can now be applied to pixel area. Assuming the same Photon Flux Density, an imager with a larger pixel size will collect a larger number of photons/pixel/sec, and will therefore have a proportionally higher SNR. Conversely, one can achieve a target SNR at a proportionally lower exposure than with an imager with a smaller pixel size. As in the case of Photon Flux, these exposure values would be in inverse proportion to the the pixel-areas, all else being equal. Larger pixels typically also accommodate a larger full-well-capacity: this means that not only do the larger pixels collect more photons, they also have a higher capacity for photoelectrons. Since SNR is proportional to the Sqrt(Signal), more photoelectrons translates to a potentially higher SNR under photon-shot-noise-limited conditions.
In the next topic, we will consider the sources of noise that are independent of Photon Flux: Read Noise and Dark Shot Noise.

