UV Cameras
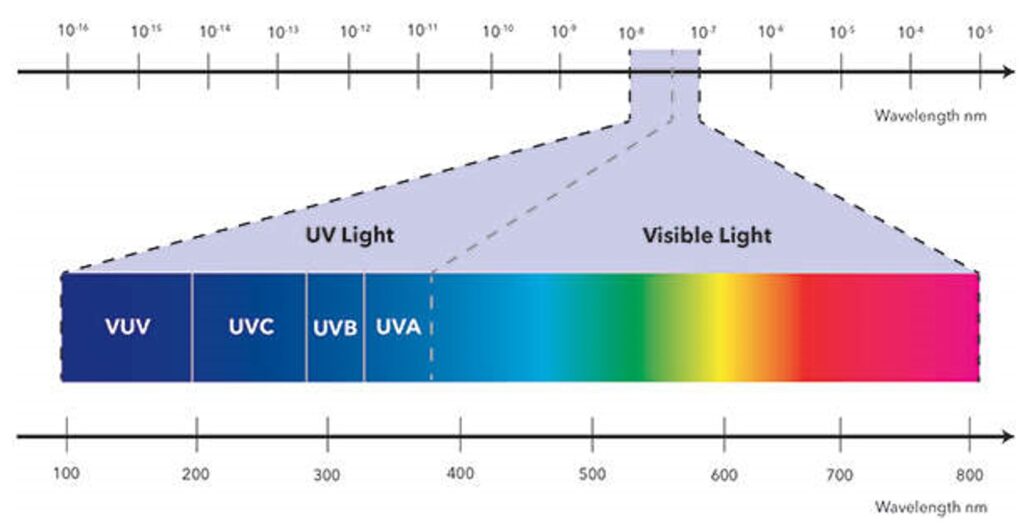
The unique properties of Ultra-Violet light [in the 150~400nm part of the spectrum] can be leveraged by using UV Cameras, lenses and light sources to go beyond what is possible with Visible light [400~700nm].

Scientists and engineers often utilize the following aspects of UV imaging in their applications:
- Higher optical resolution: as described in "How Diffraction Limits the Optical Resolution of a Microscope", the Rayleigh Criterion establishes the diffraction-limited spot size: R = 1.22*λ/(2*NA) or 1.22*λ*F# in a lens-based system. All else being equal, "R" decreases for lower values of λ in the UV region. The lower diffraction limited spot size (smaller radius of the Airy disk) enables higher optical resolution. Small features that might have been unresolvable under Visible light may be discernible with UV imaging.
- More scattering: Light of a lower wavelength is scattered more when it hits an uneven surface as compared with light of longer wavelengths. This makes it easier to detect scratches on materials when UV imaging is used.
- Differences in UV absorption/transmittance: Certain materials, including living organisms have significantly different transmittance/absorption in the UV spectrum. For example, glass and plastic that are transparent, i.e. they transmit Visible light, have different transmittance at lower wavelengths. These differences can be use to differentiate materials that would otherwise be virtually indistinguishable from each other under Visible light. Similarly, UV Imaging can be used in the detection of counterfeit currency due to the different rates of absorption of certain materials.
- UV light is emitted under certain conditions: Examples of this include certain forms of electric discharge, combustion, fluorescence in which UV light is emitted, and can thus be detected by UV sensitive cameras.
It is important to consider the specifications of the camera carefully when selecting the right product for UV Imaging applications. As described in "Camera Selection, simplified" one can select UV Cameras based on relatively simple figures-of-merit derived from readily available camera specifications to estimate the Signal-to-Noise Ratio (SNR) that one can expect from different cameras under low-light (read noise limited) conditions and and brighter-light conditions (photon shot noise limited) conditions.
Under low-light conditions, one can expect a higher SNR with cameras that have larger pixels, higher Quantum Efficiency (QE) and lower read noise. Under bright light conditions cameras with large pixels and higher QE will achieve higher SNR - all else being equal.
With this in mind, one may typically select an sCMOS UV camera for low-light UV imaging, because they have (a) large pixels (b) high QE in the UV region and (c) low read noise. These cameras typically operate in Rolling Shutter mode, in which the pixels on different rows of an imager begin and end their exposure in a staggered timing scheme. While this permits a pixel architecture that has a lower read noise, it can create certain motion artifacts when imaging fast moving events.
One may select a more cost-effective CMOS UV Camera for UV applications in which the light levels are fairly bright and other factors such as the frame rate and/or Global Shutter may be beneficial.
Note: in Global Shutter cameras, all pixels begin and end exposure at the same instant. Cameras with Global Shutter are well suited for imaging fast changes or rapid motion in the Field-of-View.
UV sCMOS Cameras
| Camera Series | TE cooled | #Mpix | Estimated QE (%) at λ = 240nm | min. read noise [e-] RMS | Number of pixels | Pixel size (µm) | Image Sensor Diagonal (mm) | Shutter type | Max frame rate at full resolution (fps) | Interface |
|---|---|---|---|---|---|---|---|---|---|---|
| Dhyana 95V2-UV | Yes | 4.2 | 79 | 1.7 | 2048 x 2048 | 11 x 11 | 31.9 | RS | 48 | USB3.0 | CameraLink |
| pco.edge 4.2 bi uv | Yes | 4.2 | 60 | 1.8 | 1.1 (Low Light Mode) | 2048 x 2048 | 6.5 x 6.5 | 18.8 | RS | 40 | USB 3.1 Gen 1 |
| pco.panda 4.2 bi uv | No | 4.2 | 54 | 1.8 | 1.1 (Low Light Mode) | 2048 x 2048 | 6.5 x 6.5 | 18.8 | RS | 40 | USB 3.1 Gen 1 |
UV CMOS Cameras
| Camera Series | TE cooled | #Mpix | Estimated QE (%) at λ = 240nm | min. read noise [e-] RMS | Number of pixels | Pixel size (µm) | Image Sensor Diagonal (mm) | Shutter type | Max frame rate at full resolution (fps) | Interface |
|---|---|---|---|---|---|---|---|---|---|---|
| UV-IUA8000KMA | No | 8.1 | 35.9 | 2.66 | 2840 x 2840 | 2.74 x 2.74 | 11 | GS | 45 | USB3.0 |
| MV4-D1280U-H01-GT | No | 1.3 | 62.9 | 42 | 1280 x 1024 | 7.4 x 7.4 | 12.13 | GS | 140 | 10GigE |
* QE at λ = 240nm is shown for each camera series.
** The Max Frame Rate shown in the above table for each camera is the maximum frame rate achievable at full-frame readout.
QE Curves
The following is an interactive plot of the QE curves for cameras based on BSI sCMOS and CMOS imagers. They are shown on one graph so that it is possible to make comparisons. The following interactive features of this graph can be helpful:
- Use your mouse to hover over the legend of a particular camera to see it highlighted in the graph below.
- Click on the legend of a camera to turn on or off its plot.
- Use your mouse to read QE data for all displayed imagers at the wavelengths of interest.
- Right-click and drag to zoom-in along the X-axis to expand the view for a desired range of wavelength.
- To pan left or right within a zoomed-in view, hold down the Shift key and use your mouse.
- To revert from the zoomed-in view to the normal view, click on the “Reset zoom” button that is displayed at the top-RHS of the graph.
How to Select a UV Camera
In the following, we use the method that is detailed in our Knowledge Base articles titled Camera Selection, simplified and Camera selection – real-world examples in which we show how one can distil information that is readily available from camera specs into simple figures of merit that directly relate to image quality (for which SNR is used as a figure of merit). The two most important coefficients to consider are Cr and Cp which allow us to make a quantitative comparison of the achievable SNR under Read Noise Limited and Photon Shot Noise Limited conditions respectively.
SNR Coefficients for UV Cameras (at λ = 240nm)
SNR Coefficients (Cp) for UV Cameras at λ = 240nm [under photon-shot-noise-limited (bright-light) conditions]
SNR Coefficients (Cp) for UV Cameras at λ = 240nm [under read-noise-limited (low-light) conditions]
Estimated Signal-to-Noise Ratios
Using the method that was described in the article “Estimating Camera Performance” we show the plot of the estimated SNR vs Exposure at different levels of Photon Flux density. For this example, we have chosen QE values at λ = 240nm, a wavelength of interest in many UV imaging applications. These graphs are provided for references purposes only – no guarantees of performance are implied.
In the following sequence, the Photon Flux Density is increased by an order of magnitude from one graph to the next. The Dhyana 95 V2 UV camera outperforms the other two cameras in all cases because it has 11μm pixels while the other two cameras have 6.5μm pixels. The TE-cooled Dhyana 95 V2 UV camera thus has nearly 2.9x the pixel area of a camera with 6.5μm pixels and is recommended for UV imaging applications which can benefit from its large (31.9mm) imager diagonal.
The first two graphs represents instances of relatively low Photon Flux Densities of 0.1 Photons/sq-μm/sec. and 1 Photons/sq-μm/sec. For these low levels of Photon Flux Densities a TE-cooled sCMOS camera is highly recommended. Either the Dhyana 95V2 camera or the pco.edge 4.2 bi camera would be good candidates for such applications.
The next two graphs represent instances of relatively high Photon Flux Densities of 10 Photons/sq-μm/sec. and 100 Photons/sq-μm/sec. In these cases all three cameras perform very well, and users would be well-advised to select the non-cooled pco.panda 4.2 bi uv due to its lower price.
The next sequence (below) represents a situation in which the Photon Flux Density is much higher, showing the case in which less expensive non-cooled cameras may be used. The Photon Flux Density is shown decreasing by an order of magnitude from 100,000 to 100. The pco.panda 4.2 bi uv (6.5μm pixels) and Photonfocus UV (7.4μm pixels) cameras are good candidates because of their pixel size. The Sony IMX487 based UV-IUA8000KMA camera is a good choice if higher spatial resolution is needed.
The first two graphs represents instances of relatively large Photon Flux Densities of 100,000 Photons/sq-μm/sec. and 10,000 Photons/sq-μm/sec. For these high levels of Photon Flux Densities either the Photonfocus UV or the pco.panda 4.2 bi uv camera would be good candidates.
The next two graphs represent instances of relatively high Photon Flux Densities of 1000 Photons/sq-μm/sec. and 100 Photons/sq-μm/sec.


